Traces
Inspect nested rollout, evaluator, model, tool, and reward spans in the dashboard.
Traces
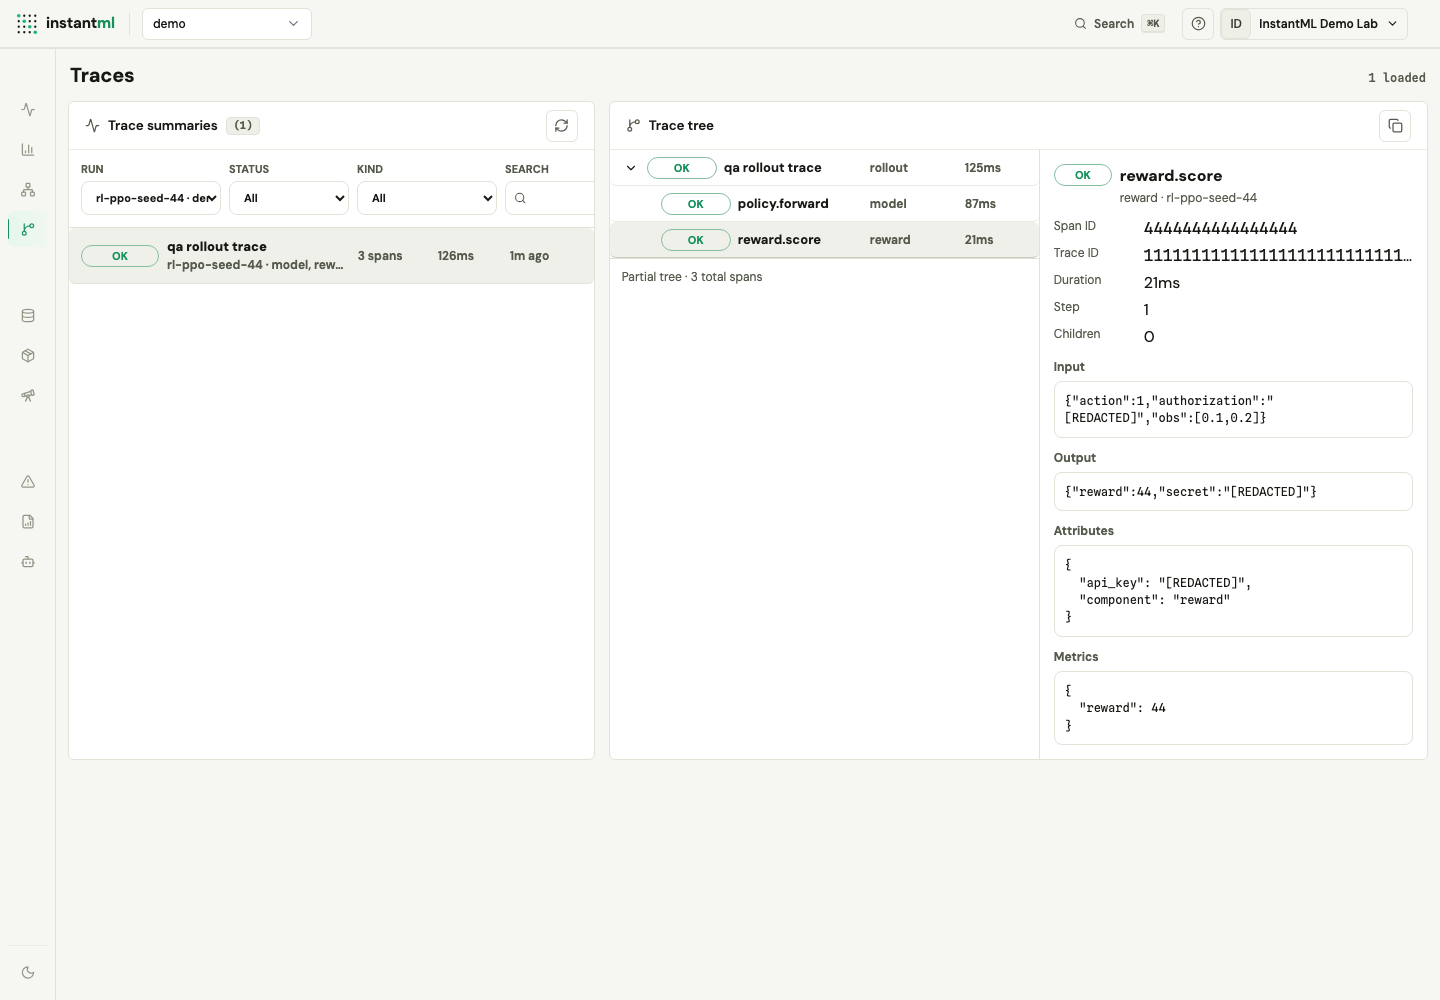
The Traces workspace is a run-scoped debugger for execution trees. It shows trace summaries on the left, a lazy-loading span tree in the center, and a span inspector on the right.
What the workspace shows
Each trace summary includes:
- Status.
- Root span name.
- Run name and span kinds.
- Span count.
- Duration.
- Last update time.
Select a trace to load its root spans. Expanding a node fetches direct child spans with GET /api/runs/:run_id/traces/:trace_id/spans, so large traces do not need to load all spans at once.
Filters
Use the top filters to narrow the list:
| Filter | Use |
|---|---|
| Run | Show traces for one run. |
| Status | Find failed, running, interrupted, or completed traces. |
| Kind | Focus on rollout, model, tool, retrieval, reward, evaluator, or custom spans. |
| Search | Match root name, trace id prefix, rollout id, or thread id. Multiple words are split into up to eight terms, and every term must match one of those fields. |
Project-scoped browsing uses the API's recent default window. Selecting a specific run, or opening a deep link with run_id, lists all traces for that run unless a date window is supplied, so older imported or backfilled runs do not disappear from the trace list.
The workspace deep-links with run_id, trace_id, and span_id query parameters, so a copied URL reopens the same run, trace, and span selection. The tree only ever selects the span named in the URL; it never substitutes a different span. Expand a parent to load its child spans on demand.
Span inspector
The inspector shows:
- Span id and trace id.
- Status, kind, duration, step, rank, and child count.
- Input, output, and error previews when preview capture was enabled.
- Attributes, metrics, and links.
Previews are bounded and redacted by the SDK before they reach the API. In the example screenshot, the reward span keeps debugging context while masking the authorization token, API key, and returned secret.
Run Detail entry point
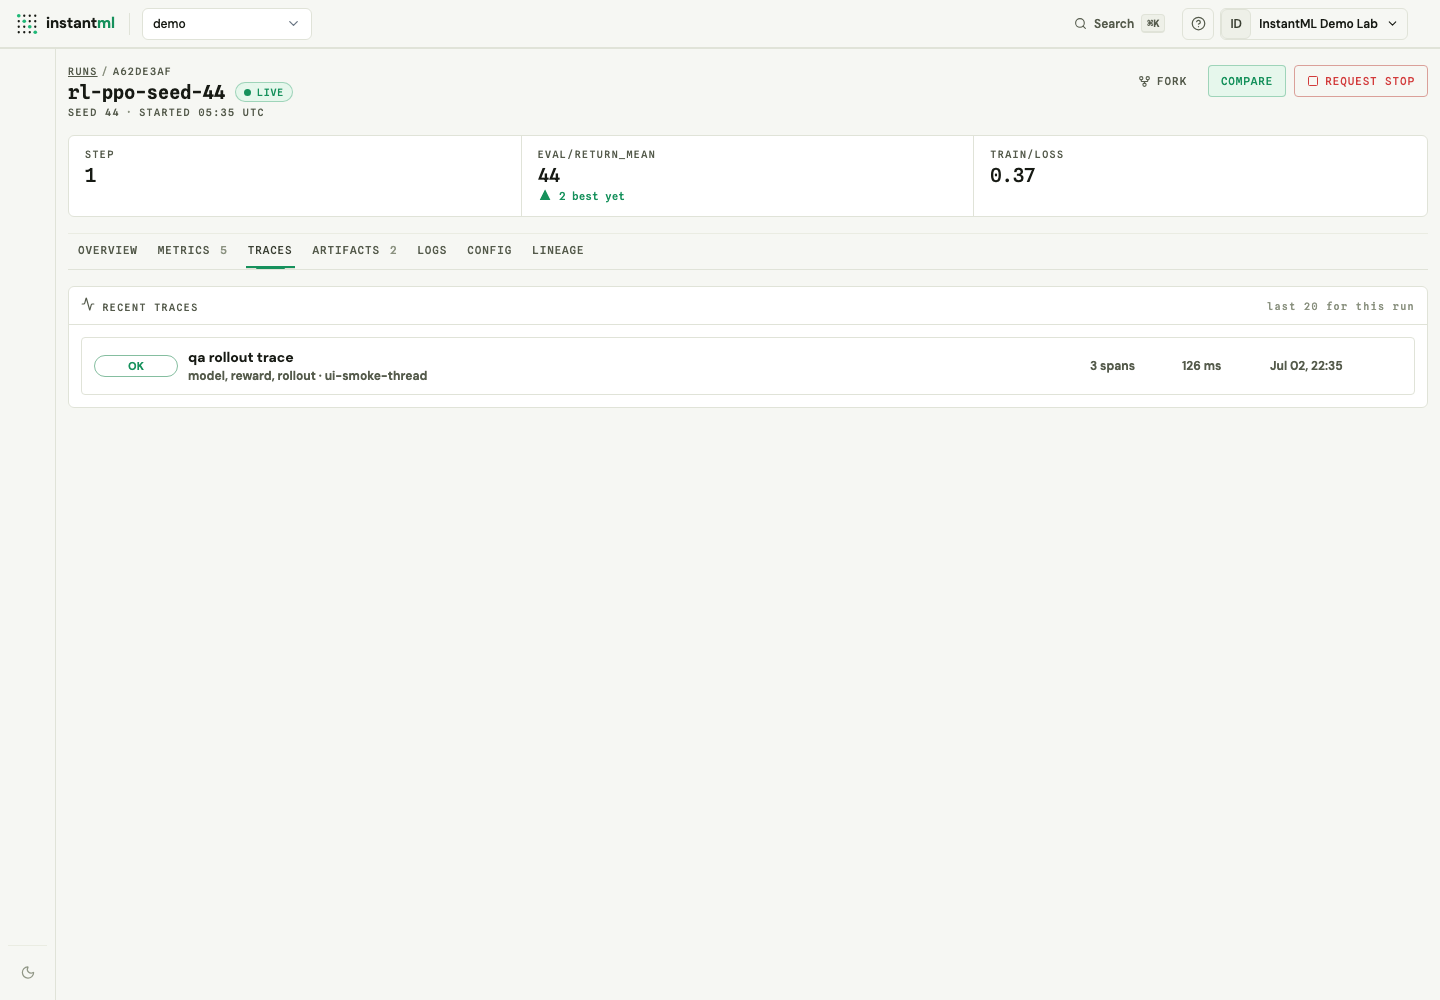
Run Detail has a local Traces section. It fetches only when opened, lists the latest traces for the selected run without applying the project-level lookback, and links each row into the full Traces workspace with the exact trace and root span selected.
Above the list, a trace activity timeline correlates one run metric with per-step trace activity on a shared step axis:
- A metric line plots the key chosen with the Metric selector.
- A lane below the axis shows one marker per step. Marker size scales with the number of traces at that step, and marker color separates normal, running, and errored steps; a danger band highlights runs of consecutive error steps.
- The panel head shows run-wide totals — total and errored traces plus the covered step range.
- Clicking a step pins the list below to that step and shows a clearable filter chip; the list then refetches with
min_step/max_stepset to the step.
The totals are always run-wide and include traces logged without a step, so they can exceed the sum of the visible buckets, and the pinned list shows only the selected step's traces. The lane covers the first 2,000 distinct steps of a run; longer runs are truncated with a note. Runs with no stepped traces show the recent list without the lane. The underlying aggregate is GET /api/runs/:run_id/traces/steps.
Use the Run Detail section when you are already inspecting one run. Use the global Traces workspace when you want to filter across runs or inspect a tree in detail.
Common workflow
- Open a run from the Runs workspace.
- Click Traces in Run Detail.
- Open a recent trace.
- Expand the tree until the model, tool, reward, or evaluator span you need is visible.
- Use the inspector to compare inputs, outputs, attributes, metrics, and error previews.