Runs workspace
Search, select, sort, visualize, and save workspace views for many runs.
Use the Runs workspace as your daily command center: it combines a run selector, summary stats, visualization panels, saved views, and a bounded server-backed run list.
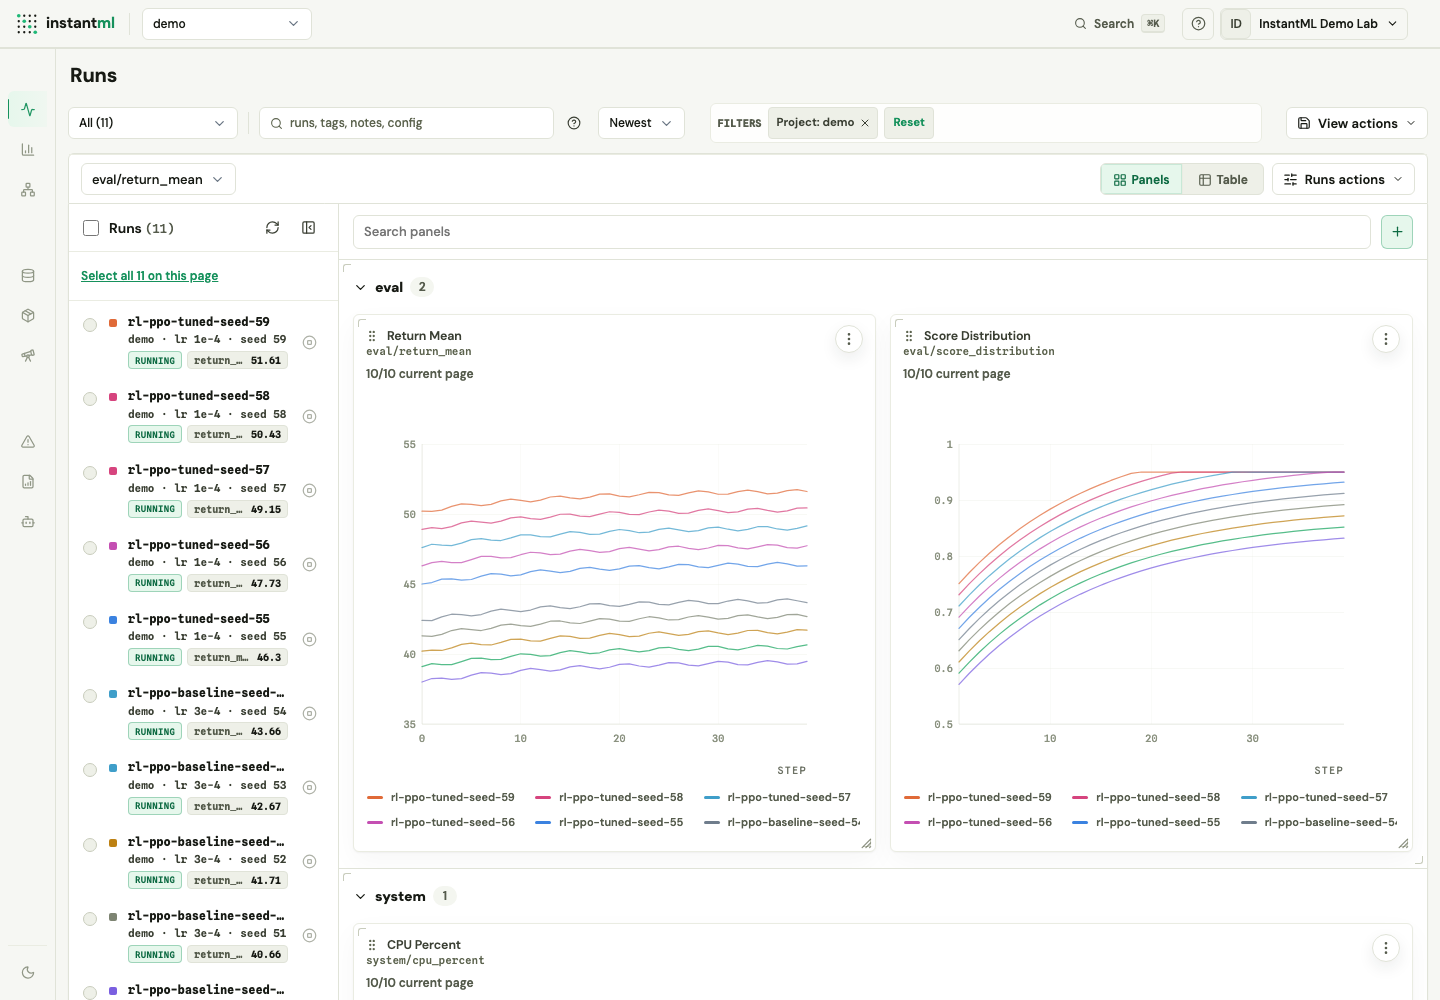
Switch between Panels and Table
The Runs command bar carries a metric selector, a Panels ⇄ Table toggle, and a Runs actions menu:
- Panels is the run selector rail plus the chart canvas described below.
- Table is a flat, sortable run list with selectable columns and pinned metric columns. Selecting two or more runs renders an embedded comparison above the table.
- Runs actions holds Export CSV, review-stop-requests, and refresh.
The chosen view is remembered per browser.
Search and sort runs
Use the search field for names, tags, notes, configs, and indexed run context. Bare text such as reward stability keeps implicit-AND matching. Add precise filters with tag:baseline, status:finished, name:"long context", -tag:debug, (tag:baseline OR tag:candidate) notes:ablated, or re:/seed-(13|14)/. The help icon beside the search box mirrors this syntax, and invalid searches keep the last valid results visible.
The Sort selector offers:
- Newest
- Latest metric — the selected metric's latest value.
- Best metric — the selected metric's goal-aware best value.
- Name
- Status
- Duration
Select runs in bulk
The run rail supports:
- A master checkbox for the visible page.
- Shift-click range selection.
- A banner to select all matching runs when more runs match than fit on the current page.
Large selection pages use a lightweight selection projection so the UI does not fetch full metric aggregates for every selected run.
Export selected runs
Use Export CSV in the Runs actions menu to download the selected runs and their bounded project, metric, attribute, artifact, rich-object row, and import metadata. The dashboard calls GET /api/export?format=csv&run_ids=..., so the download follows the same org, project, role, and API-key rules as the API.
Build panels
The workspace starts with a capped, high-signal set of line panels built from logged metric keys. Manage the set with three controls:
- Add panels — the plus-icon button in the canvas toolbar. It opens a drawer where you add only the charts you need.
- Rebuild layout — a refresh-icon button that regenerates the default panel set from logged metrics. It appears only after you have customized the layout.
- Per-panel remove, so you can drop charts you don't want.
The workspace supports seven panel types:
| Panel type | Data source | Shows |
|---|---|---|
| Line | Selected-run metric series | A metric over step or time |
| Bar | Loaded run summaries | Latest values ranked across runs |
| Value histogram | Loaded run summaries | The spread of latest values across the current run set |
| Dot plot | Loaded run summaries | Point-style comparisons that preserve run identity |
| Scatter | Loaded run summaries | Two numeric run fields, such as a config value versus a best metric aggregate |
| Distribution | Loaded run summaries | Seed or ablation stability grouped by a categorical config, metadata, status, or first-tag field |
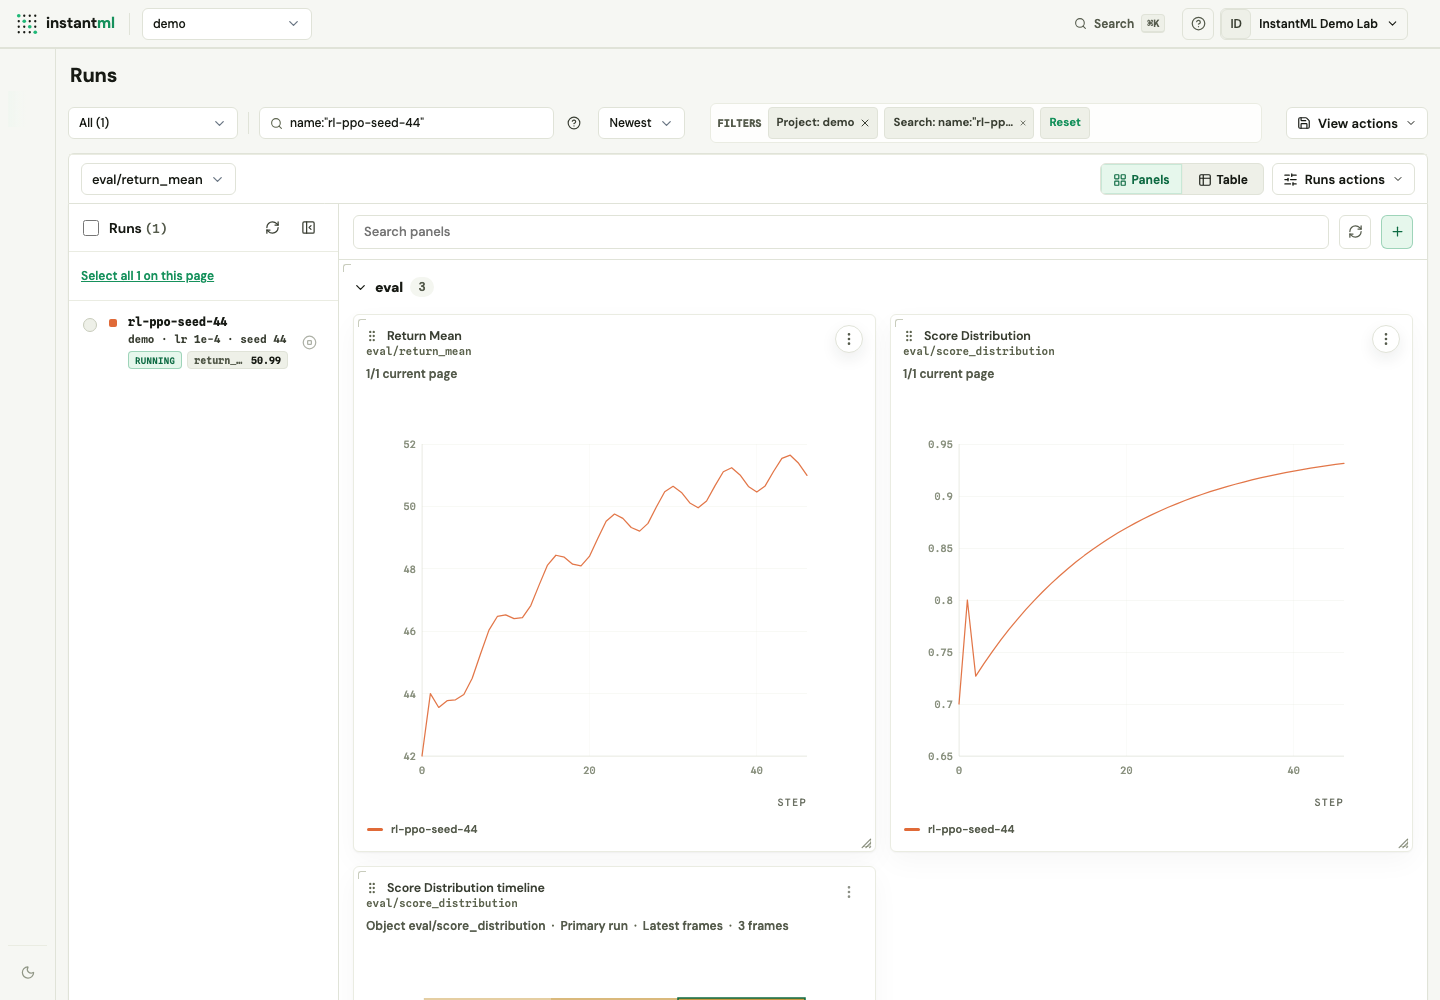
| Logged histogram timeline | One selected run's histogram objects | A distribution evolving over steps |
Two panel types have extra behavior worth knowing:
- Distribution — small groups render strip points plus a median; larger groups add compact box summaries.
- Logged histogram timeline — takes one primary run and one explicit histogram object key. It uses
GET /api/runs/:id/objects?kind=histogramwith a key filter and renders the latest 100 frames as a compatible-bin heatmap, or a selected-frame fallback when bins changed. Add one by typing the histogram object key; metric rows are only suggestions when a scalar metric happens to share the same key.
Choose the right graph
Most panels come from scalar metrics logged with run.log_metrics(...). Logged histogram timelines are the rich-object exception: they read selected-run histogram objects logged with run.log_objects(...).
| Graph | Log this | Use when |
|---|---|---|
| Line | Scalar metric per step, such as train/loss | Training dynamics, smoothing, and step/time inspection. |
| Bar / dot plot / value histogram | Same scalar metric key across runs | Latest-value comparison: bars rank, dots preserve run identity, histograms show spread. |
| Scatter | Two numeric summary fields | Tradeoffs such as learning rate vs accuracy, duration vs score, or loss vs F1. |
| Distribution | Scalar outcome plus group and seed config | Seed variance or ablation stability by variant, method, dataset, model, status, metadata, or tag. |
| Logged histogram timeline | Histogram object key plus shared bins | One selected run's confidence, activation, reward, latency, or calibration distribution over time. |
| Parallel coordinates | Numeric config plus metric summaries | HPO/sweep tradeoffs in Insights, not saved Runs workspace panels. |
To keep runs chart-friendly:
- Keep metric keys stable and namespace them by purpose:
train/loss,eval/accuracy,eval/return_mean,optimizer/lr,system/gpu_utilization. - Put repeatable experiment settings in
config:seed,variant,learning_rate,batch_size,model,dataset.
import instantml as im

score_bins = [index / 32 for index in range(33)]

run = im.init(
    project="reward-sweep",
    config={"variant": variant, "seed": seed, "learning_rate": learning_rate},
    tags=[variant],
)

run.log_metrics(
    {"train/policy_loss": policy_loss, "eval/return_mean": return_mean},
    step=step,
)
run.log_objects(
    {
        "eval/score_distribution": im.Histogram.from_values(
            eval_scores,
            bins=score_bins,
        )
    },
    step=step,
)Know what each panel fetches
Line panels load selected-run series through bounded chunked requests. Dense series render paths on canvas while preserving axes, legends, hover readouts, raw values, and smoothed values when smoothing is active. Large comparisons use the stable chart palette first, then dashed line styles after the palette wraps so overlapping runs stay distinguishable.
Scatter, distribution, bar, value histogram, and dot plot panels are summary-only:
- They use already loaded run summaries and never fetch full metric histories or rich objects.
- Their scope is the selected runs when a selection is active, otherwise the visible loaded run page capped by the panel limit.
- Scatter fields must be numeric: metric summaries, numeric config or metadata, duration, or created time. Distribution value fields are numeric too, while grouping fields can be categorical config, metadata, status, or first tag.
- They do not include lasso selection, density overlays, or project-wide all-matching queries.
The panel below shows a selected-run histogram timeline with shared bin edges across frames. Open it fullscreen to scrub frame-by-frame.
Parallel coordinates remain in Insights as an exploratory HPO/sweep view over loaded summaries rather than a saved Runs workspace panel.
Line panels include chart CSV and SVG image export for the visible plotted sample. Summary panels are designed for fast visual comparison inside the workspace; use selected-run CSV export when you need raw run rows.
Save layouts and views
Panels can be moved, resized, collapsed, edited, and opened fullscreen. Named layouts are saved through the control-plane workspace-view API, so a saved view survives reloads and browser changes.
Use keyboard shortcuts
| Shortcut | Action |
|---|---|
Cmd/Ctrl+K | Quick search |
? | Shortcut help |
Esc | Dismiss top overlay |
Cmd/Ctrl+Z | Undo workspace change |
Cmd+Shift+Z / Ctrl+Y | Redo workspace change |
Cmd/Ctrl+. | Collapse or restore run selector |
Cmd/Ctrl+J | Move focus between Runs selector and canvas |
1–9 | Jump to tab in rail order (1 = Runs) |
| Left/Right Arrow | Traverse fullscreen panels |