Distributed and Insights
Use research dashboards for rank-aware metrics, grouped reducers, and exploratory summaries.
Use Distributed and Insights when a scalar line chart is not enough: rank-aware views for one distributed run, and exploratory summaries over many runs.
Analyze a distributed run
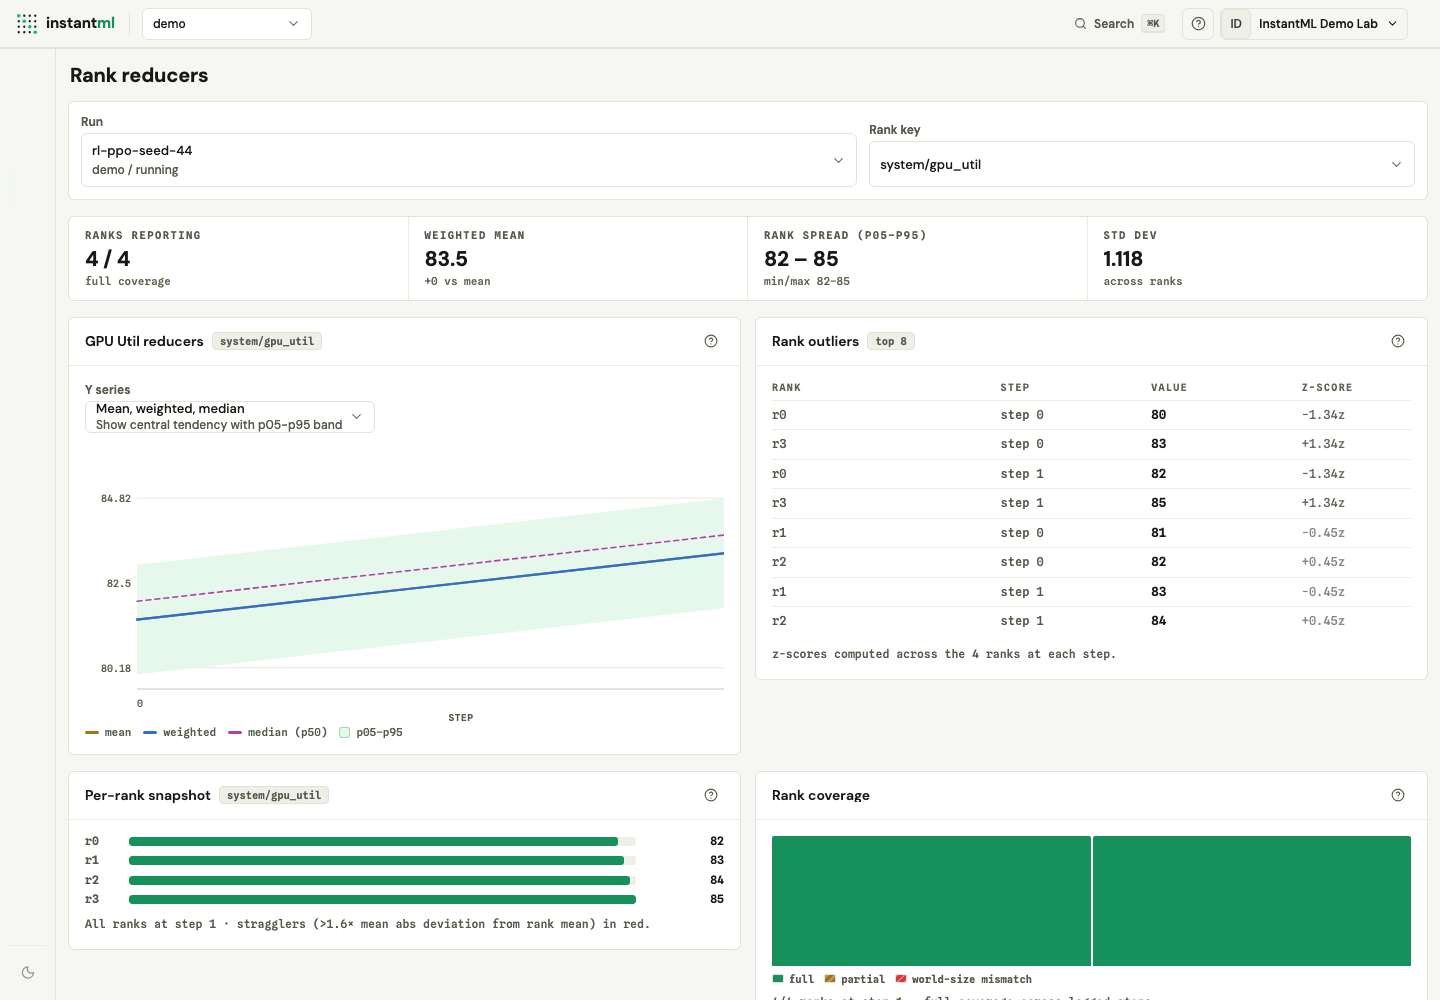
Distributed (titled Rank reducers) is scoped to one selected run and is aimed at jobs where individual ranks or workers each log values. Pick a run and a rank key to see:
- Reducer lines — mean, weighted mean, and median, with a p05–p95 band.
- Rank coverage versus the expected world size.
- A per-rank snapshot at the latest step.
- A deviation heatmap and the highest-deviation rank/step outliers.
Log the inputs with rank-aware metrics:
run.log_rank_metrics(
    {"train/loss": loss},
    step=step,
    rank=rank,
    world_size=world_size,
)
Explore run summaries in Insights
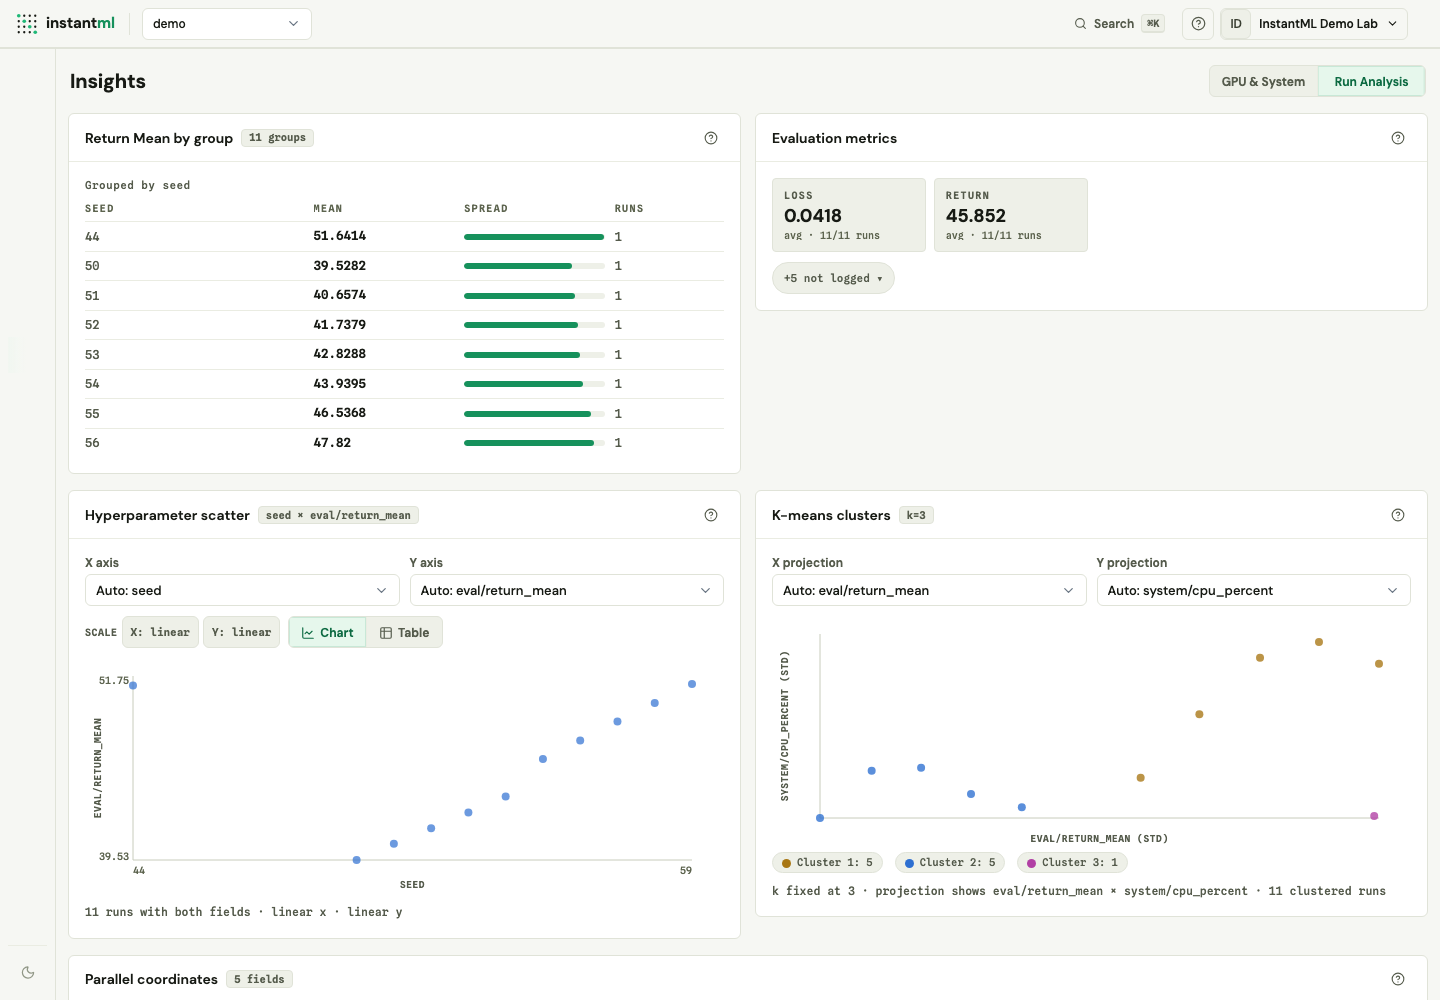
Insights has two views, switched with the toggle in its header and defaulting to Run Analysis:
- GPU & System summarizes GPU and system-usage telemetry across the loaded or selected runs.
- Run Analysis holds exploratory views over the run summaries: grouped reducers, an evaluation-metric summary grid, hyperparameter scatter, k-means cluster projections, and parallel-coordinate traces for sweep/HPO tradeoffs.
These views are exploratory and summary-only; they are not saved Runs workspace panels.
Parallel coordinates work best when the loaded or selected run summaries have several numeric config or summary fields with real variation: learning rate, batch size, duration, best validation score, return mean, loss, or accuracy. Keep seed as replicate metadata instead of a default axis, and use Runs workspace distribution panels when the main question is "is this variant stable across seeds?"
Log the inputs with ordinary SDK run config and scalar metrics:
import instantml as im

run = im.init(
    project="sweep",
    config={"learning_rate": lr, "batch_size": batch_size, "seed": seed},
)
run.log_metrics({"eval/accuracy": accuracy, "train/loss": loss}, step=epoch)
Pick the right surface
| Surface | Use it when |
|---|---|
| Runs | You need a fast broad scan |
| Metrics | You need one metric charted carefully |
| Run Detail | You need to inspect one run |
| Compare (Runs → Table) | You have a candidate set and need differences |
| Distributed | Rank/worker context matters |
| Insights | You want exploratory summaries over the loaded/selected runs |