Metrics and charts
Inspect metric series, grouped averages, smoothing, zoom, and point hover details.
Use the Metrics surface to answer "what happened to this metric across the selected runs?" with careful line charts.
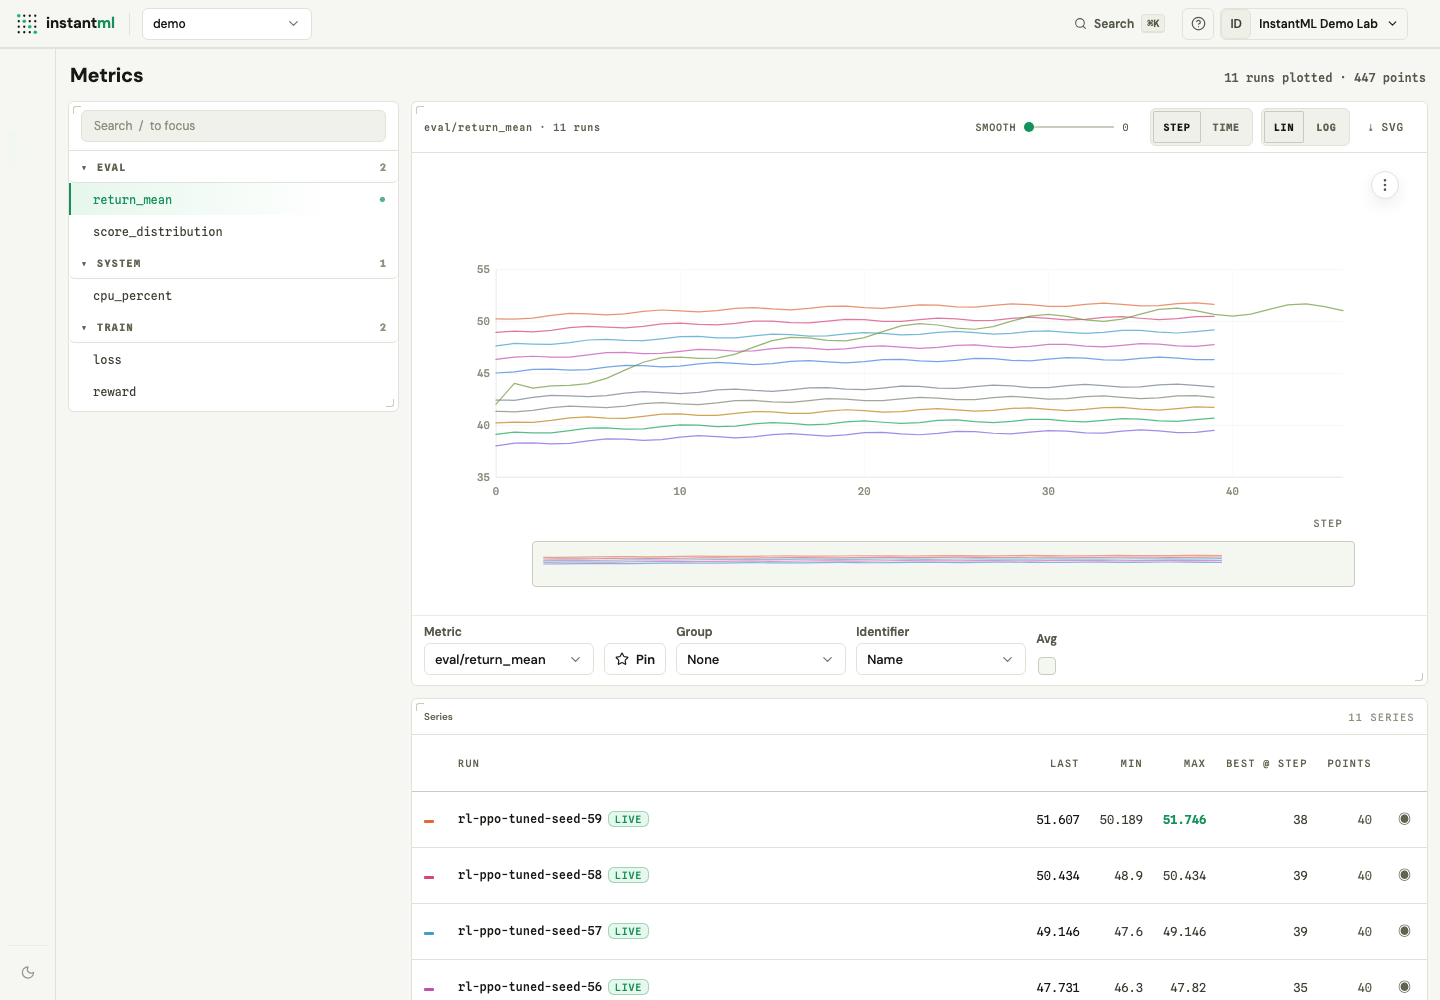
Metrics views are line-chart focused: use them for scalar metric series over training step or logged time. Use the Runs workspace when you need bar, value histogram, dot plot, scatter, seed/group distribution, or selected-run logged histogram timeline panels.
Browse metrics by namespace
The metric browser on the left groups available metric keys by namespace and shows coverage, point count, goal-aware best value, and selected-run presence. Type in its search field — or press / from anywhere on the page — to filter, and pin a key to keep its own chart below the main one.
Control the chart
Current chart controls include:
- Selected metric.
- Step or logged-time x-axis.
- A linear or log y-axis.
- A Chart / Summary table toggle for the same selection.
- Optional smoothing.
- Grouped averages.
- Group by seed, first tag, or the current fixed config grouping options such as
algoandpolicy. - Range brush zoom.
- Hover readouts with run name, step or logged time, raw value, and smoothed value when smoothing is active.
- Chart CSV export for the plotted sample and SVG image export for the visible graph.
Unit-bounded metrics such as accuracy, F1, precision, recall, and AUC use a normalized 0..1 y-axis. Return, reward, and loss metrics auto-scale.
Read the series table
Below the chart, the series table lists each plotted run with its last, min, max, best-at-step, and point count. Toggle a run's visibility to focus the chart on a subset without changing the underlying selection. Pinned metrics render as their own charts stacked under the primary one.
Log scalar metrics that chart well
Use scalar metrics when each step has one numeric value. These metrics can feed line charts, Runs workspace line panels, and loaded-summary panels such as bar, value histogram, dot plot, scatter, and distribution.
| Metric shape | Good graph types | Examples |
|---|---|---|
| Smooth or noisy time series | Line charts with optional smoothing | train/loss, eval/return_mean, optimizer/lr, system/gpu_utilization |
| Latest scalar outcome | Bar, dot plot, value histogram | eval/accuracy, eval/macro_f1, eval/return_mean, val/loss |
| Final, best, or latest scalar outcome grouped by variant | Distribution | eval/return_mean grouped by config.variant with config.seed as replicate metadata |
| Hyperparameter or runtime tradeoff | Scatter and Insights parallel coordinates | config.learning_rate vs eval/accuracy, duration vs score, loss vs F1 |
Do not force arrays, tables, confusion matrices, or per-example predictions into scalar metrics. Log those as rich objects so the dashboard can fetch them through bounded object routes instead of bloating the scalar metric hot path.
For per-sample distributions over time, log histogram rich objects with im.Histogram.from_values(scores, bins=shared_edges) under a stable object key. For binary classifier evidence, use run.log_classification_eval(...) so Run Detail can render PR/ROC, confusion matrix, per-class metrics, and prediction rows.
Read dense charts
Metric charts share the same visual system as Runs workspace line panels:
- Stable color assignment keeps the same run visually consistent across chart reloads.
- Dashed line styles are added after the palette wraps so larger selected sets remain distinguishable.
- Dense charts draw series paths on canvas and keep SVG axes, legends, and hover state above the canvas.
- Legends show the first visible run labels and add an overflow chip when the selected set is larger than the visible legend budget.
Export chart evidence
Each chart's three-dot options menu offers Download data (CSV) and Download image (SVG); the Metrics header also has a one-click SVG button. Use them when you need to move evidence into a notebook, issue, report, or lab note. CSV export contains the already plotted data, including the visible sample, grouping labels, series type, source run count for aggregates, step/time, value, and smoothed value when smoothing is active. SVG image export renders the visible chart client-side without requesting additional history.
Metric series are fetched separately from run summaries: charts request bounded series data by run, metric key, step range, time range, or explicit point limit instead of loading full history with the run list.
Follow good metric hygiene
- Keep metric names stable across runs.
- Prefer slash namespaces.
- Use scalar metric keys for numeric values only; use rich objects for arrays, tables, media, histograms, and typed eval bundles.
- Put numeric fields such as
learning_rate,batch_size, andseedin runconfigfor scatter and Insights panels. Put categorical fields such asvariant,dataset, andmodelinconfigfor distribution grouping and filtering. - Log one training-loop dictionary per step instead of many tiny calls.
- Use consistent step semantics inside a project.