Dashboard tour
Walk through every main dashboard surface and learn when to use each one.
Follow this tour to learn where each surface lives and the loop the dashboard is built for: scan many runs, chart a metric, open one run, then compare candidates.
Navigate the dashboard
The left rail groups surfaces into three sections:
| Group | Surfaces |
|---|---|
| Operate | Runs, Metrics, Distributed |
| Data | Datasets, Artifacts, Insights |
| System | Run Health, Reports, Agent |
Two surfaces are reachable without a rail item:
- Run Detail — open any run from the Runs workspace.
- Compare — select two or more runs in the Runs Table view.
Settings is not in the rail. Open the profile menu in the top right and choose Workspace settings to open it as a centered modal. The same menu holds New workspace, the light/dark theme toggle, and Sign out; billing lives inside the Workspace settings modal as its own section.
Scan runs in the Runs workspace
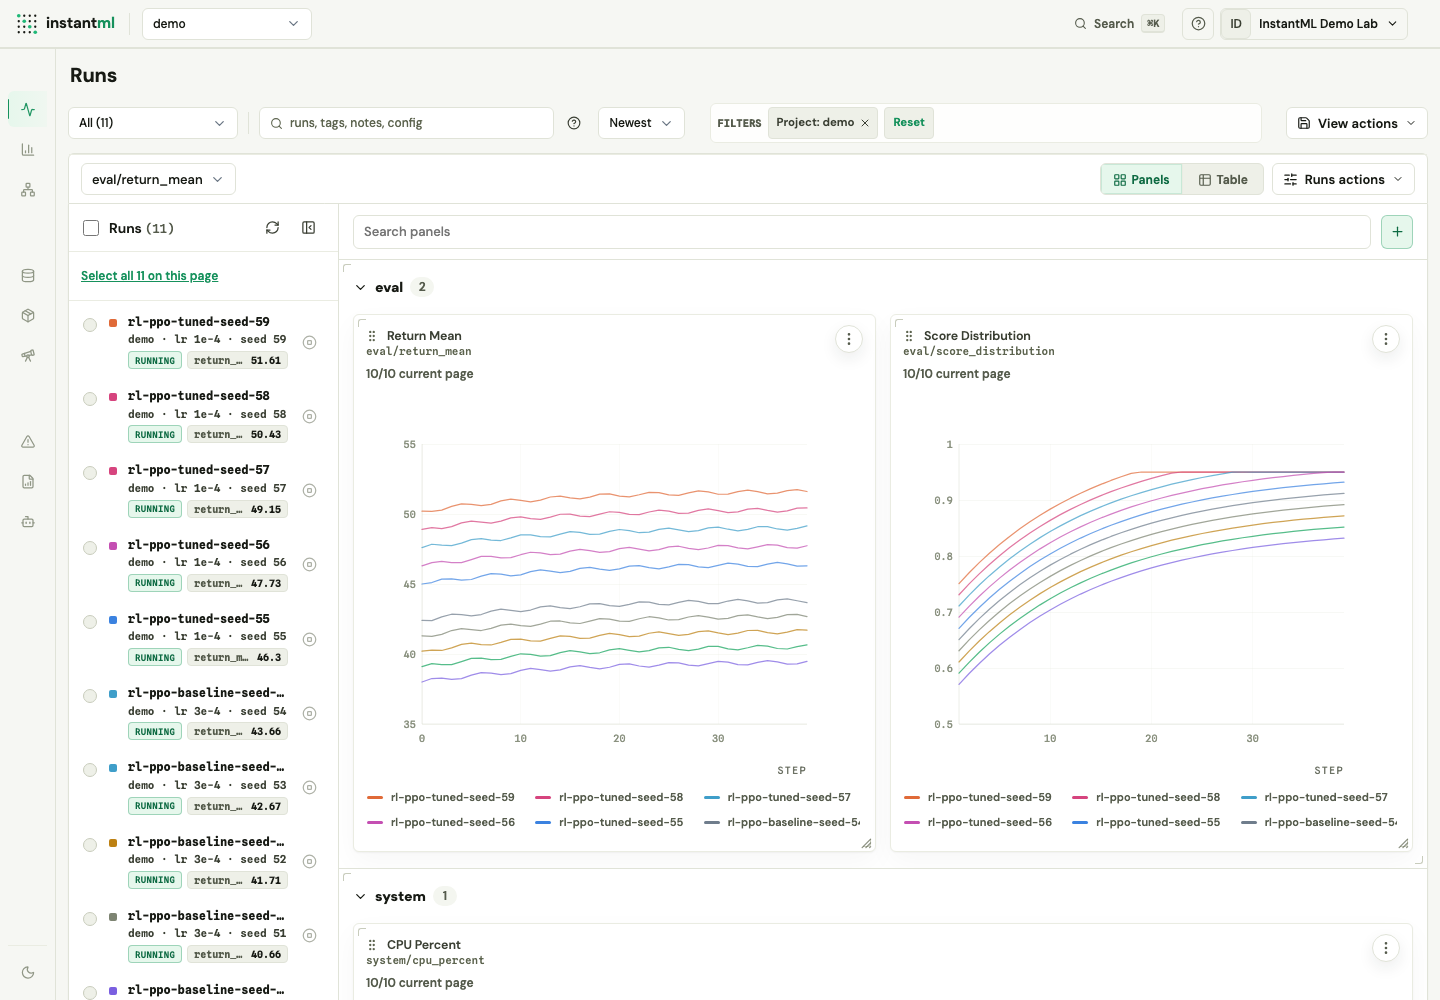
Runs is the broadest view of a project. Filter by project, status, search text, and sort mode, then select runs from the rail. Toggle between Panels (run selector plus chart canvas) and Table (a flat, sortable run list with an embedded comparison). The Runs actions menu exports selected runs as CSV and reviews stop requests. Save a named view when a layout should survive a reload. See Runs workspace for panel types, search syntax, and shortcuts.
Switch workspaces
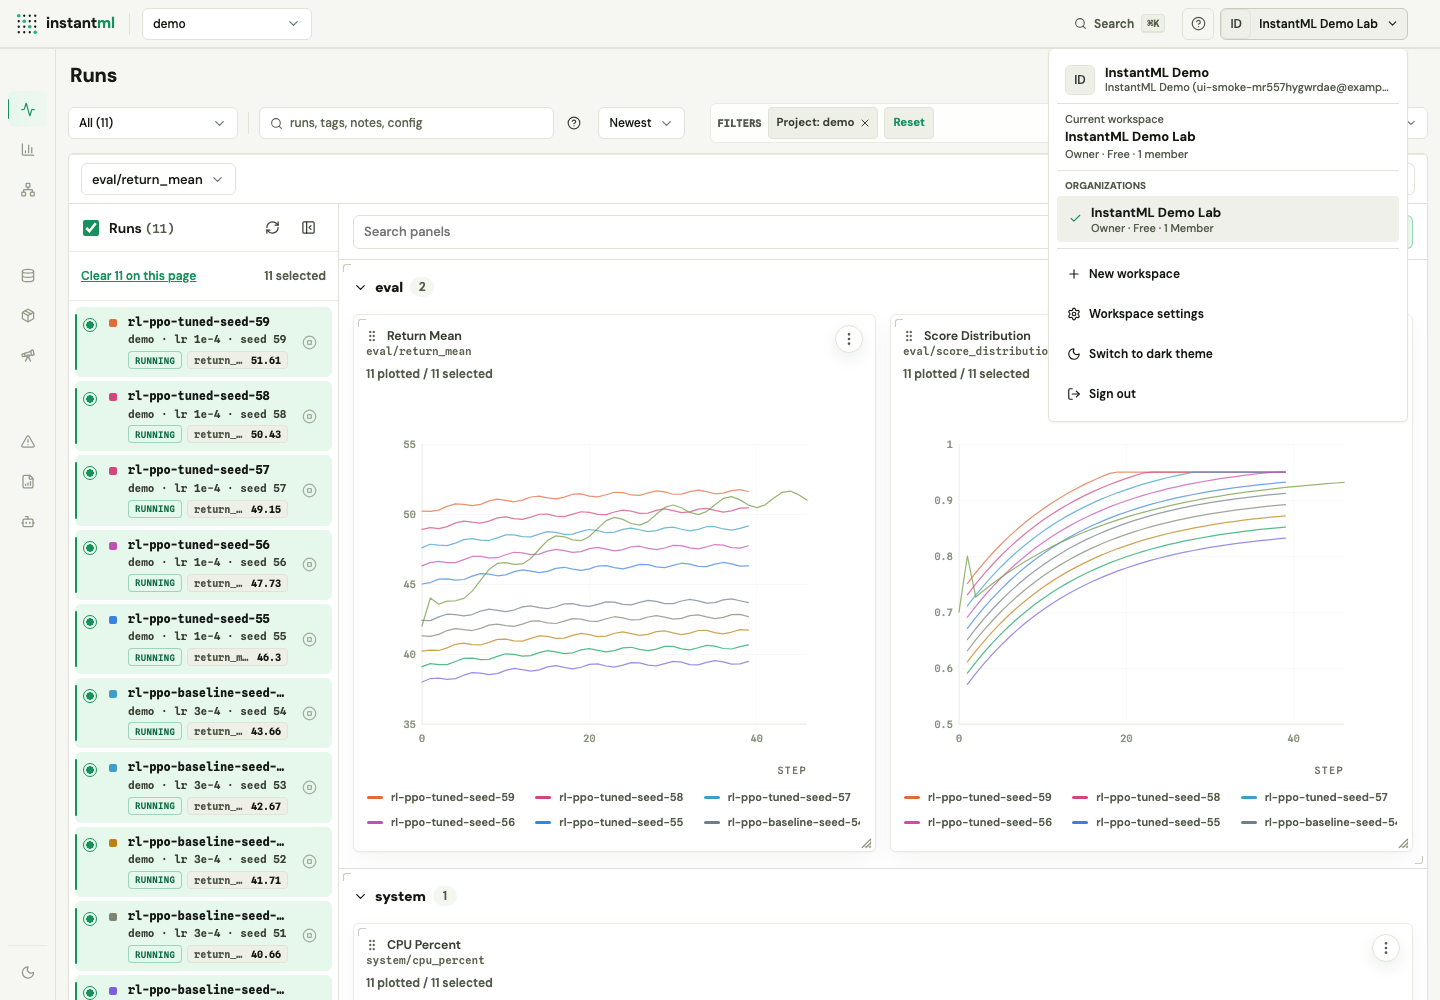
The top-right account menu shows the active workspace and switches between your personal and organization workspaces. It also creates new workspaces and opens the Workspace settings modal. See Organizations and workspaces for hierarchy and roles.
Chart metrics
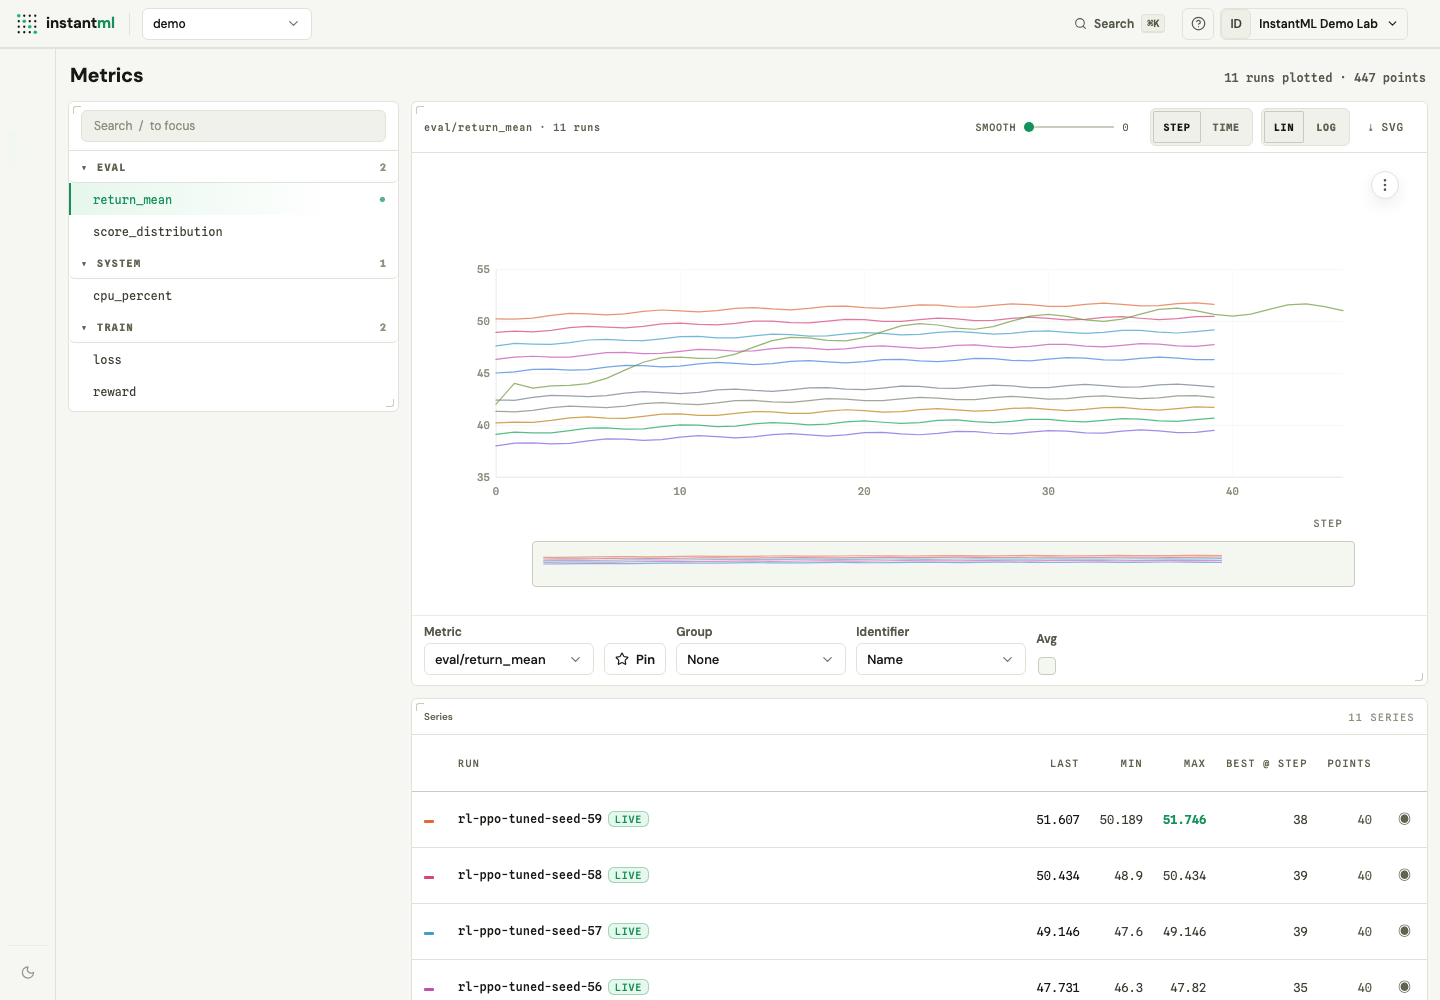
Metrics is line-chart first. A metric browser on the left groups logged keys by namespace. The chart supports smoothing, a step/time x-axis, a linear/log y-axis, and grouped averages, with a series table for showing, hiding, and pinning runs. Export downloads the plotted CSV sample or an SVG of the visible graph.
Inspect one run
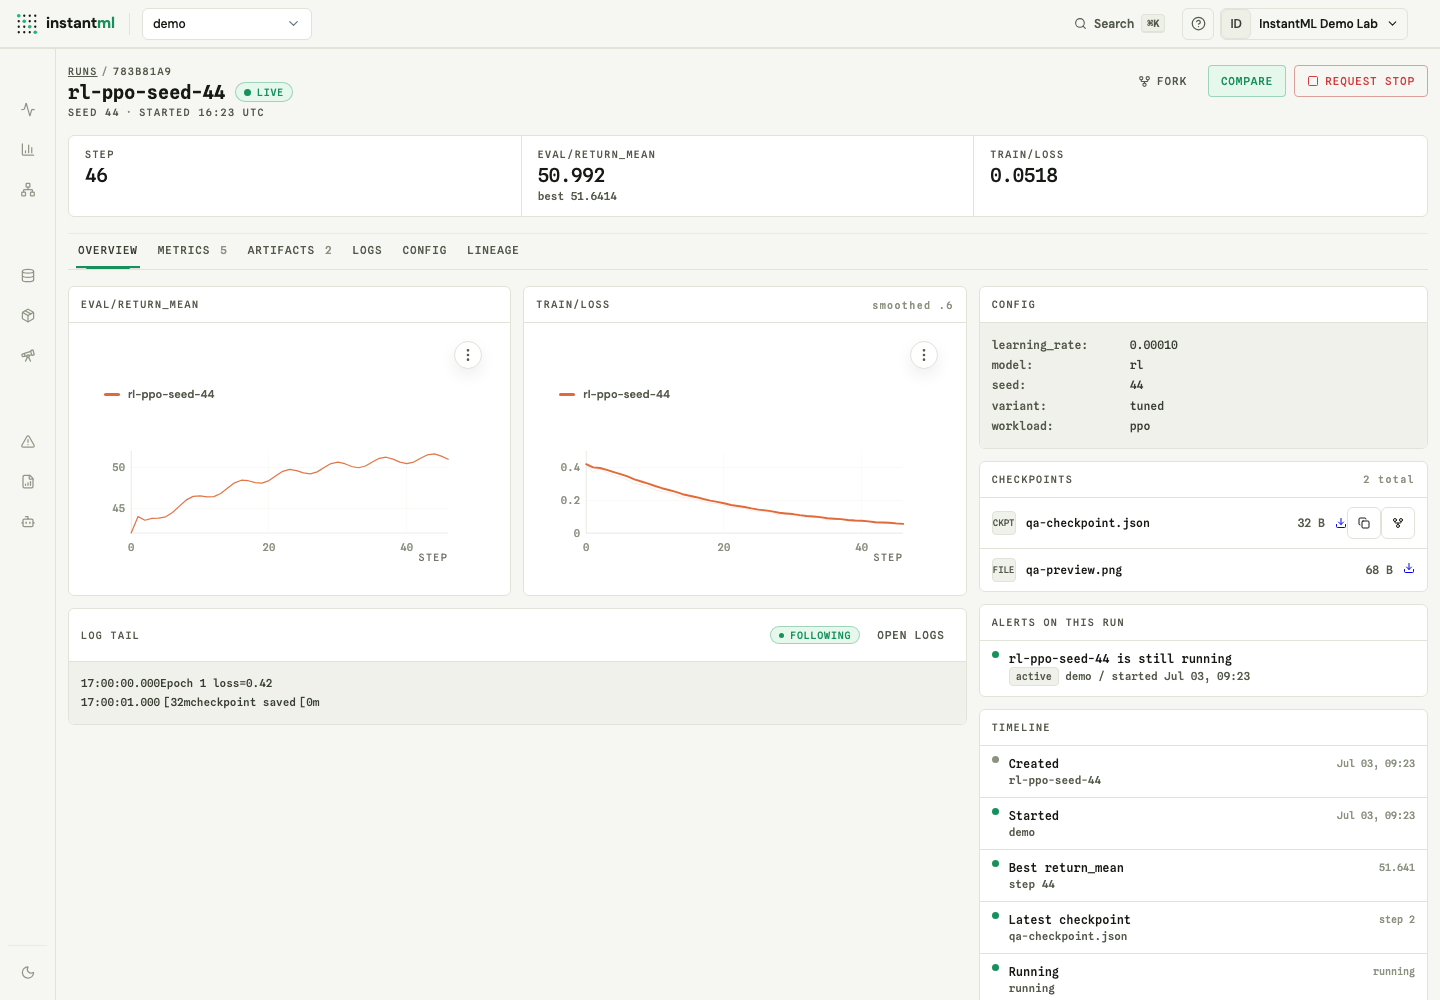
Run Detail focuses on a single run. A KPI cockpit summarizes step progress, the headline eval metric, loss, throughput, GPU util, and ETA. Header actions fork the newest checkpoint, jump to Compare, or request a stop. Local sections cover summary, data, traces, logs, files, system context, and graph lineage.
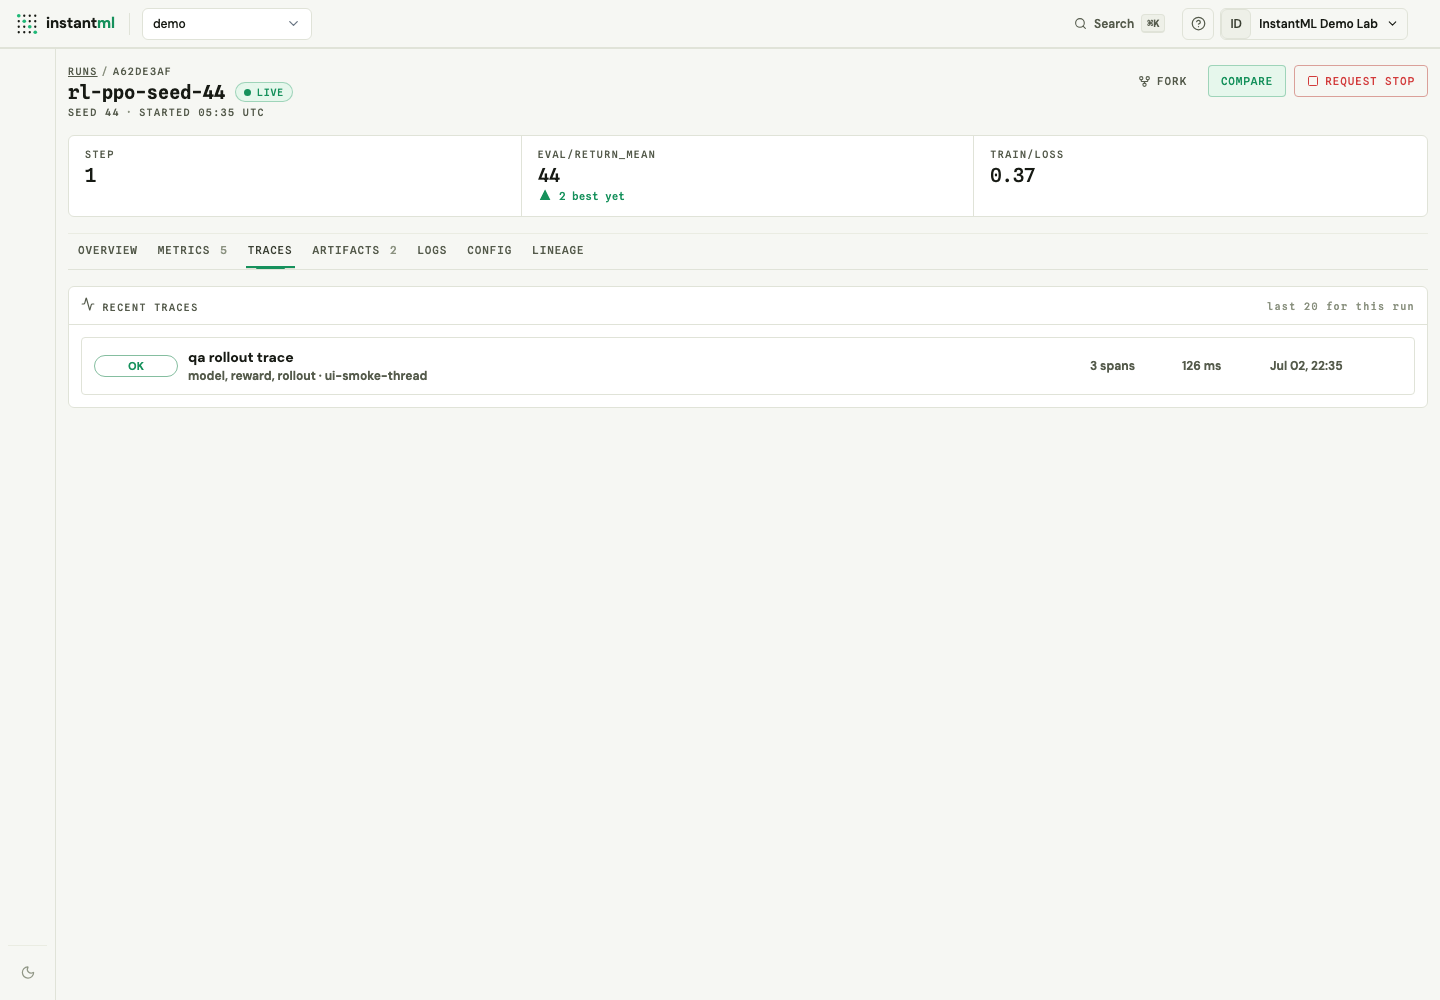
The Traces section fetches recent traces only when opened. Each row links to the full trace tree with the exact run, trace, and root span selected.
Traces
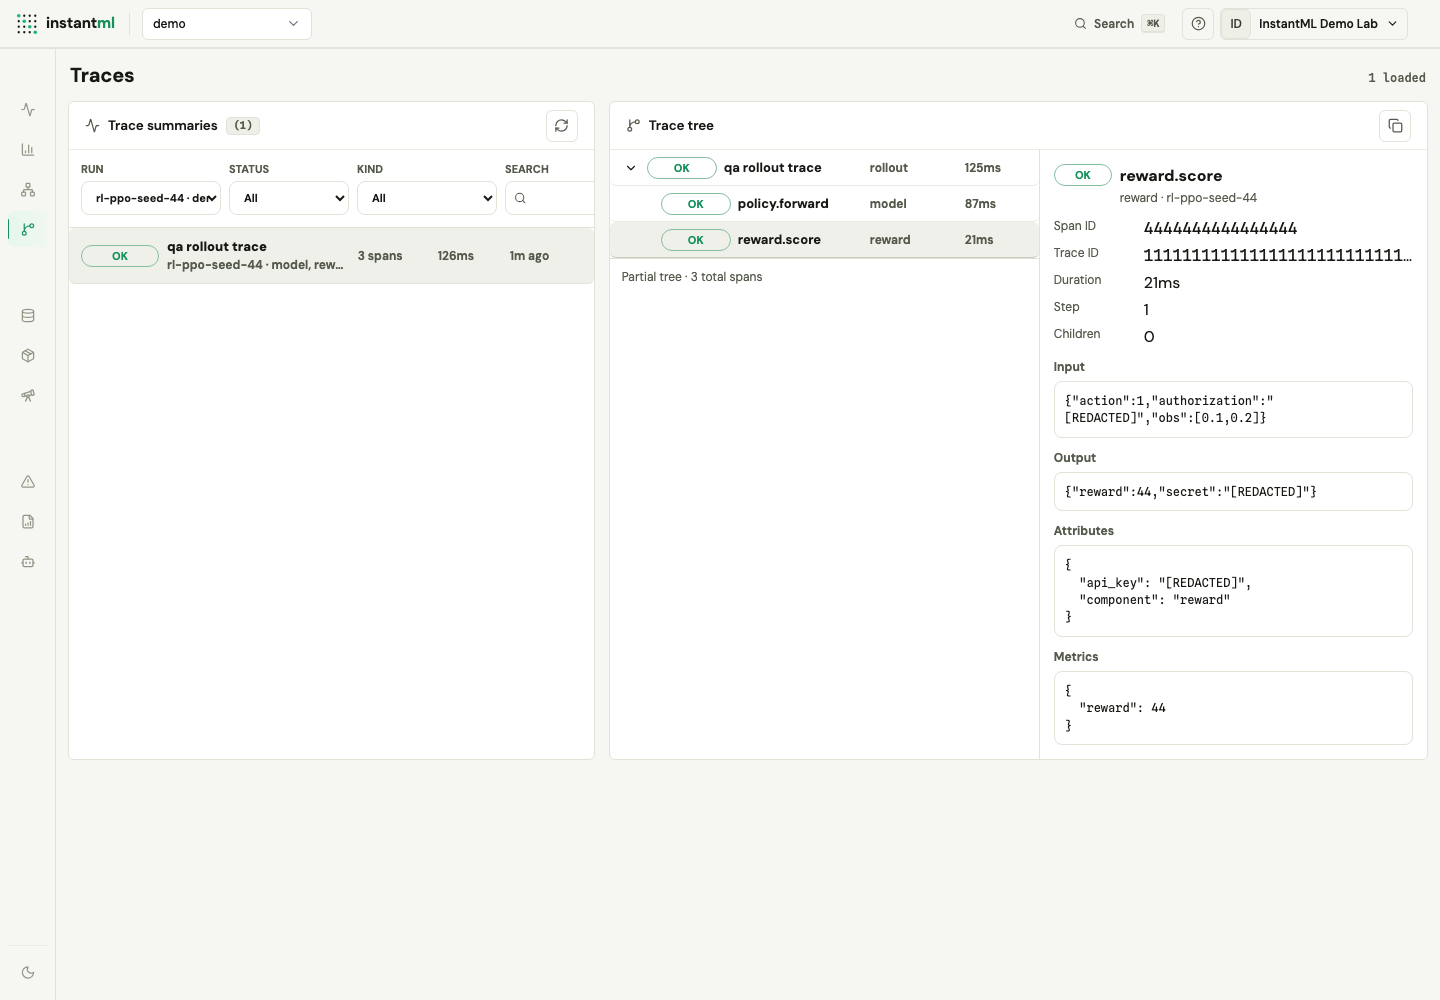
Traces is a run-scoped debugger for rollout, model, tool, retrieval, reward, and evaluator spans. Filter by run/status/kind/search text, expand child spans without loading the full tree up front, and inspect redacted previews, attributes, metrics, and links in the side panel.
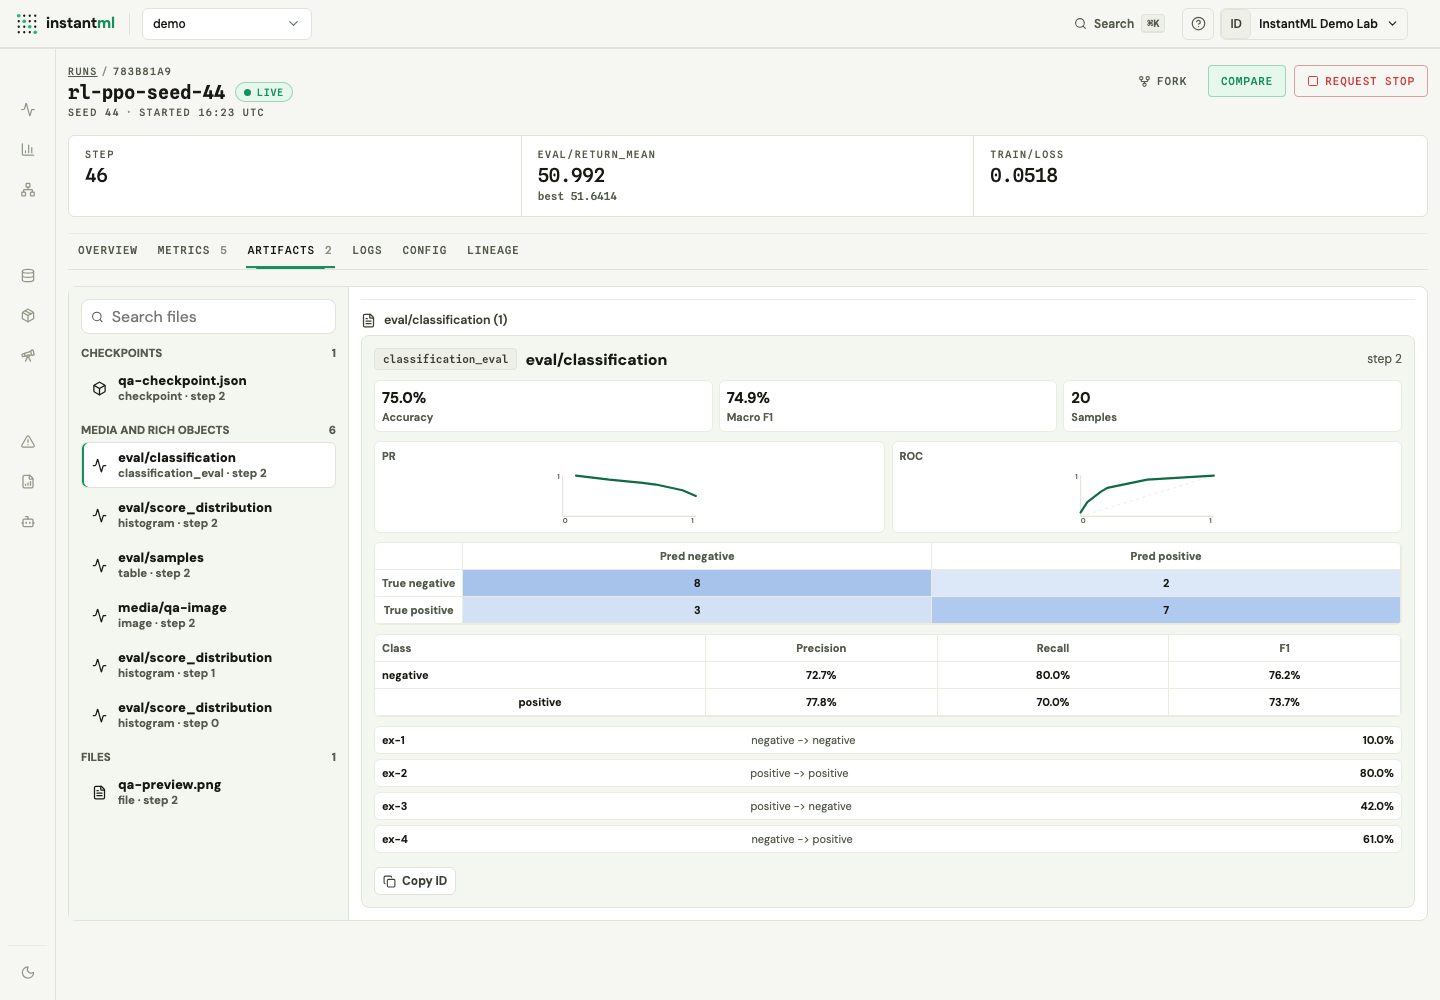
The Files section lists checkpoints, rich objects, evaluation bundles, media, and artifact metadata without loading those payloads on the initial summary view.
Compare candidates
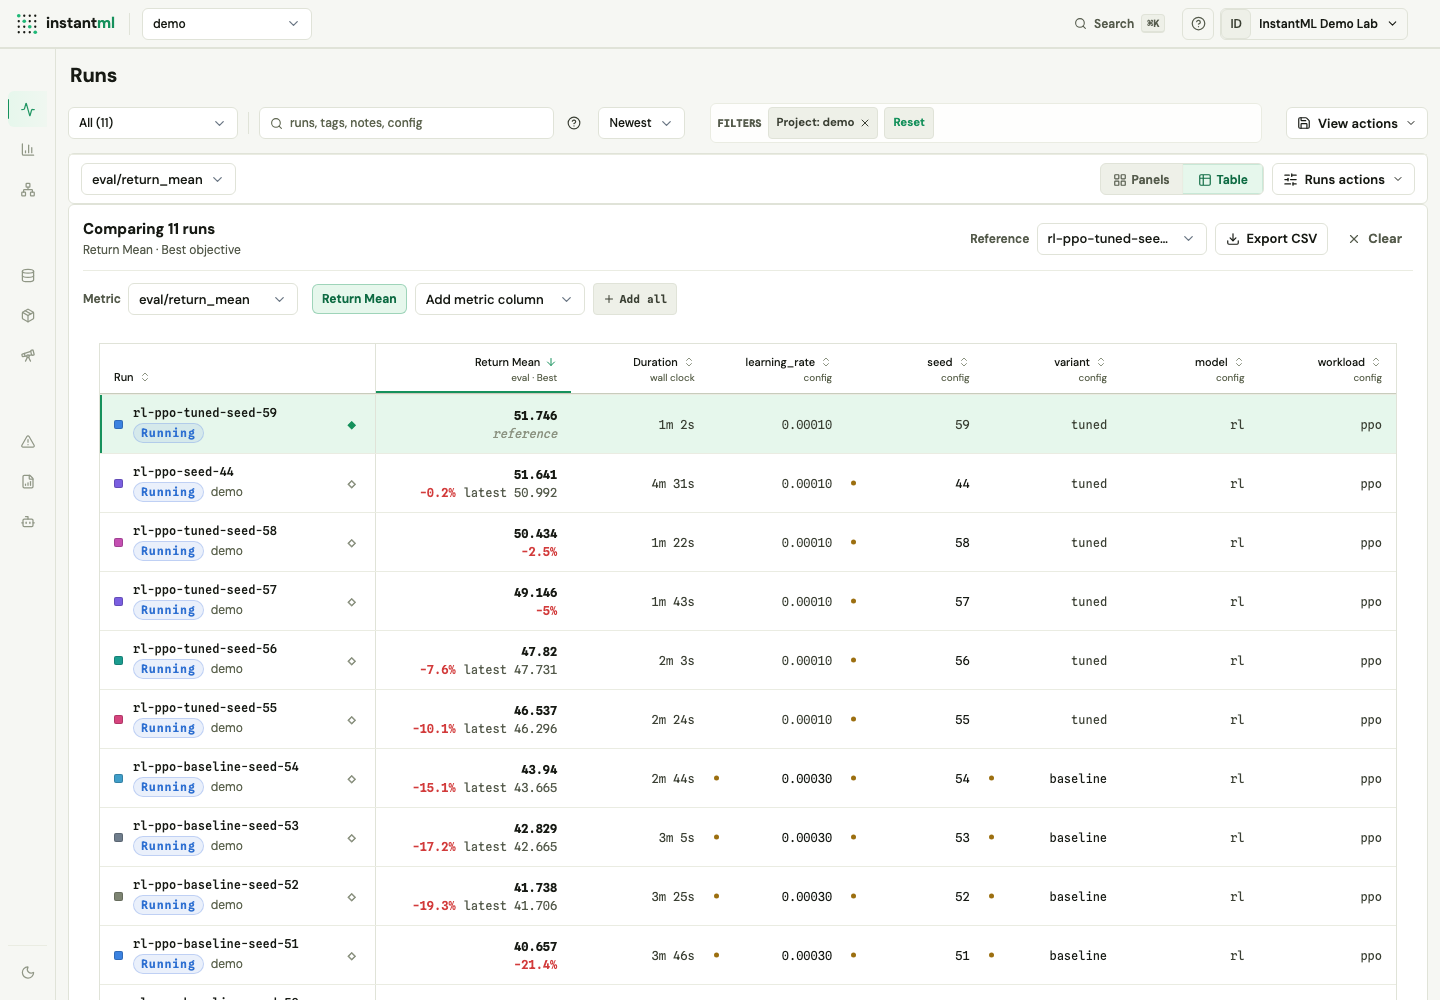
Comparison lives at the top of the Runs Table view. Select two or more runs and they render side by side with a reference run, goal-aware deltas, and addable metric columns. Use it after Runs has narrowed the candidate set.
Analyze distributed runs and Insights
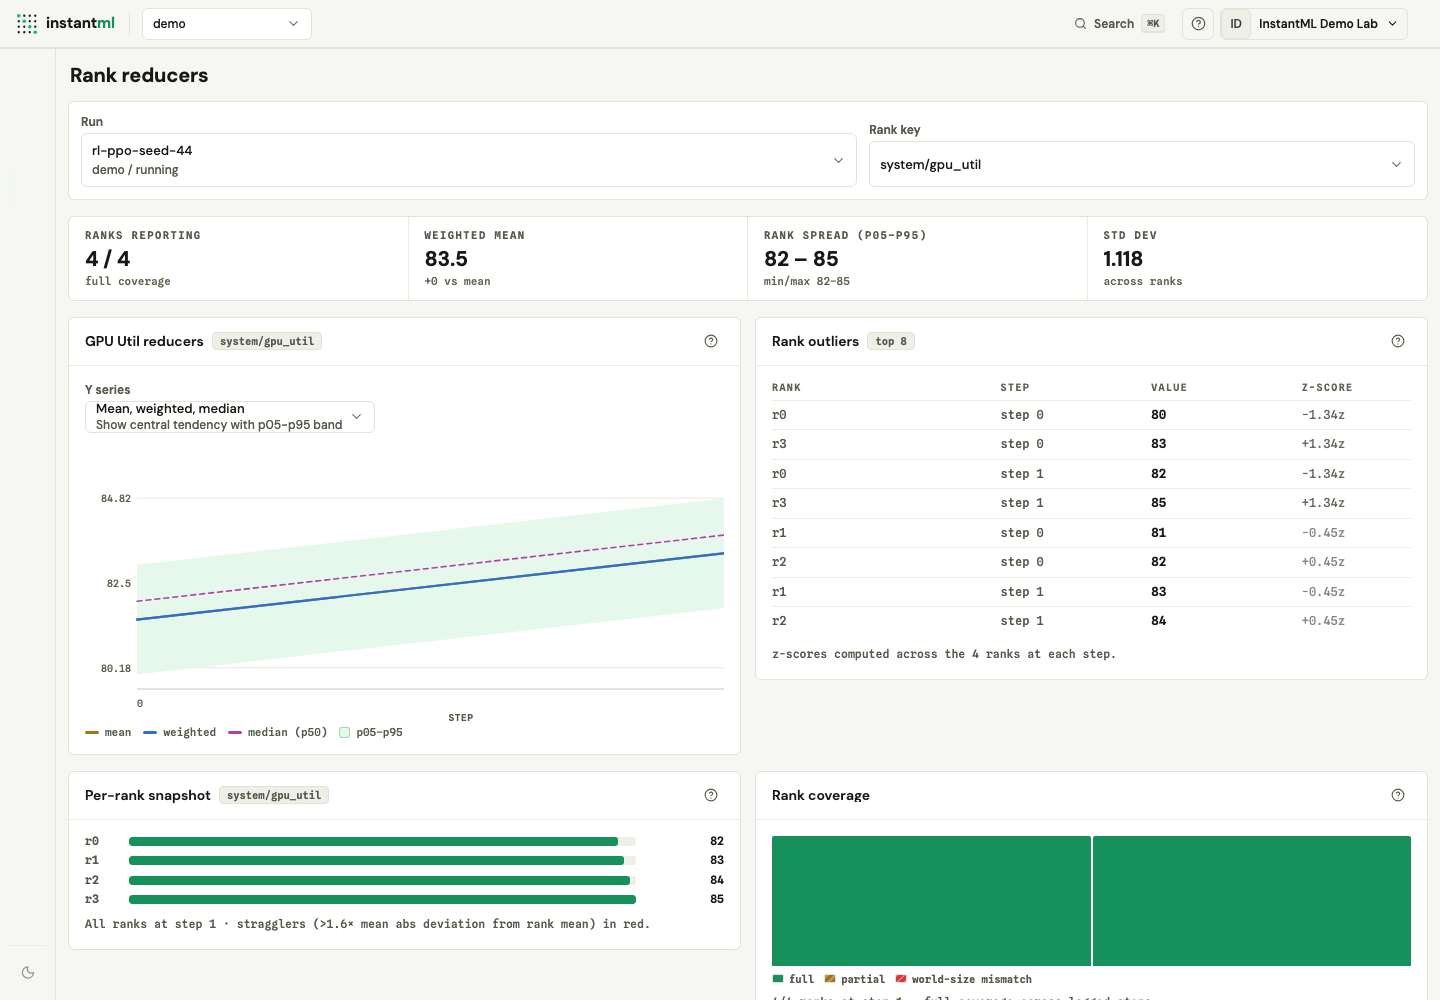
Distributed is a rank-aware view for one selected run: reducer lines, rank coverage, per-rank snapshots, heatmaps, and outliers from metrics logged with run.log_rank_metrics(...).
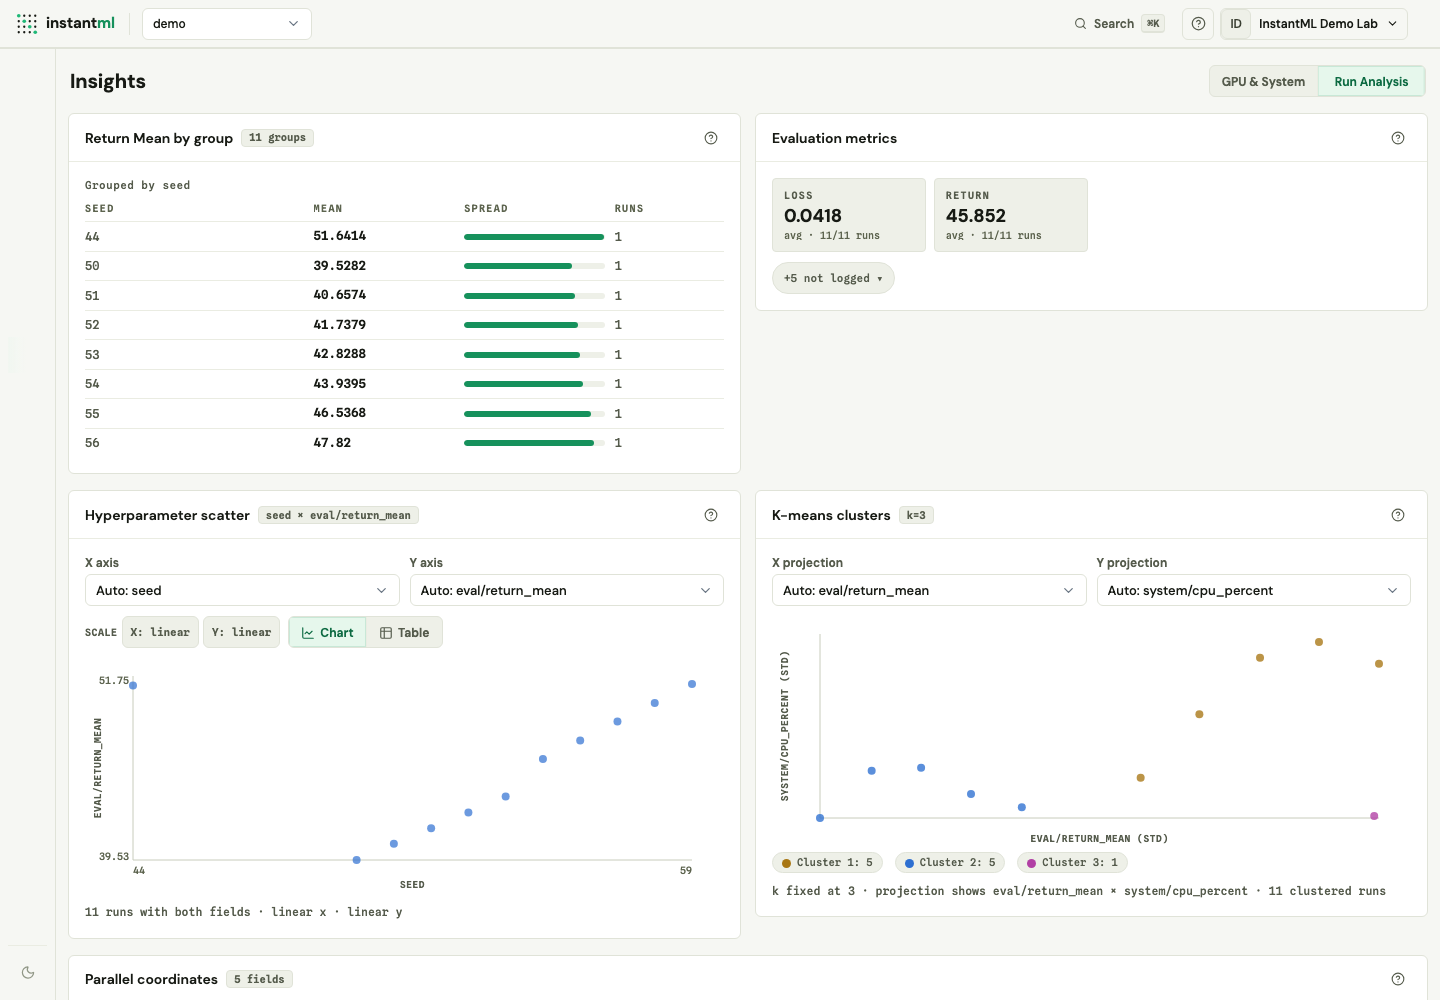
Insights has two views — GPU & System usage and Run Analysis (grouped reducers, hyperparameter scatter, k-means clusters, evaluation summary cards, and parallel-coordinate sweep traces). Both operate over the loaded or selected run summaries.
Fork checkpoints and trace lineage
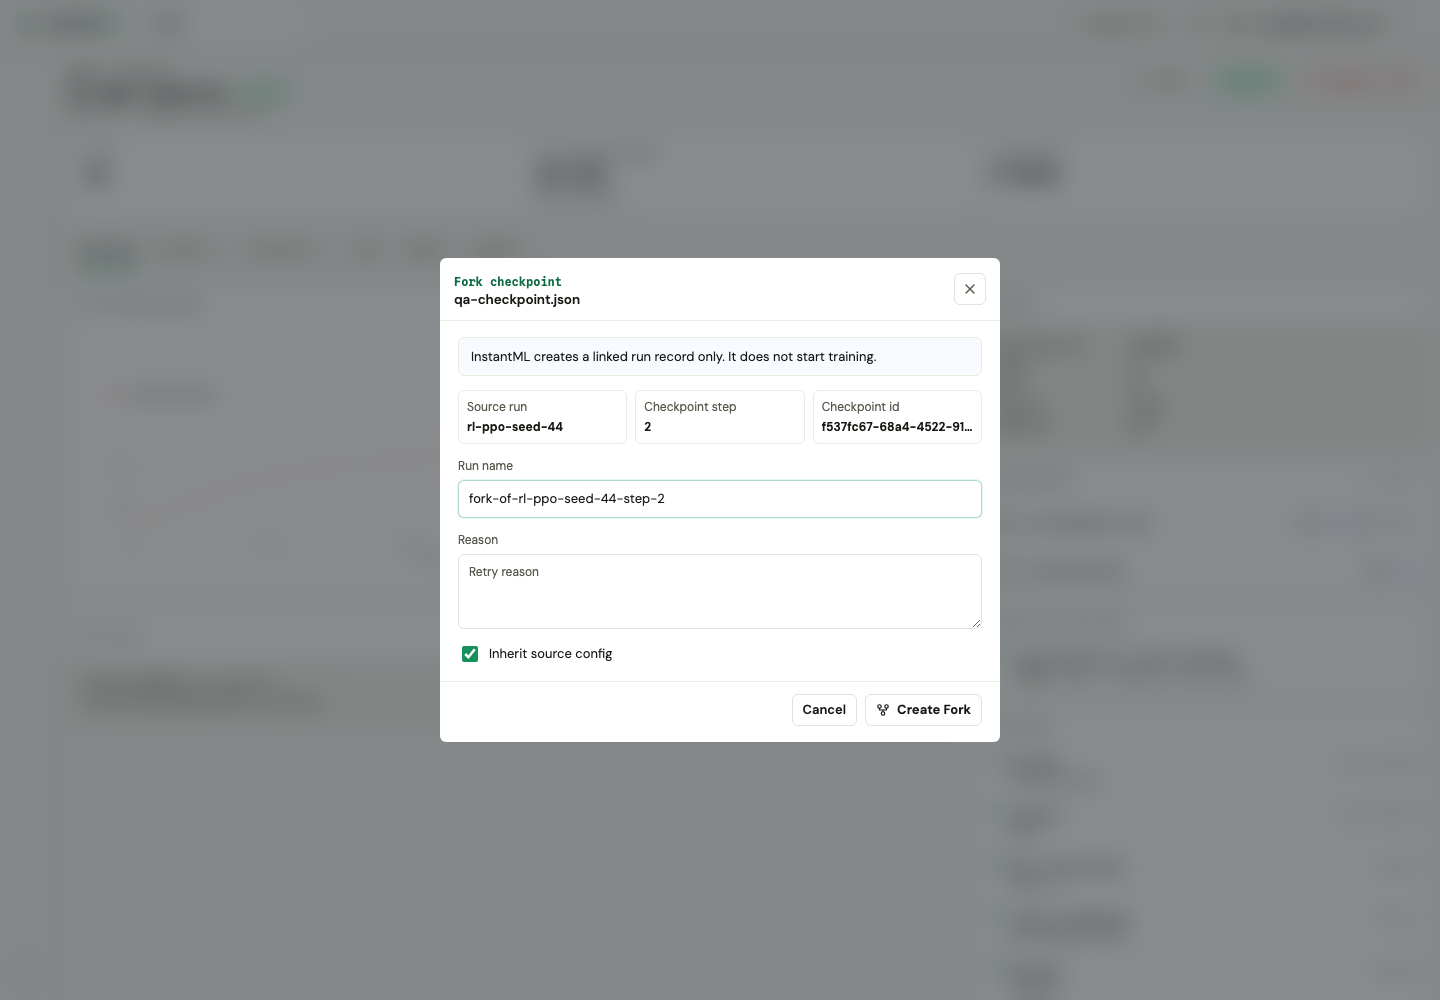
Checkpoint rows expose download, resume-code, and fork actions. Forking creates a linked child run record only; training starts when a user or script attaches to that run and logs new data.
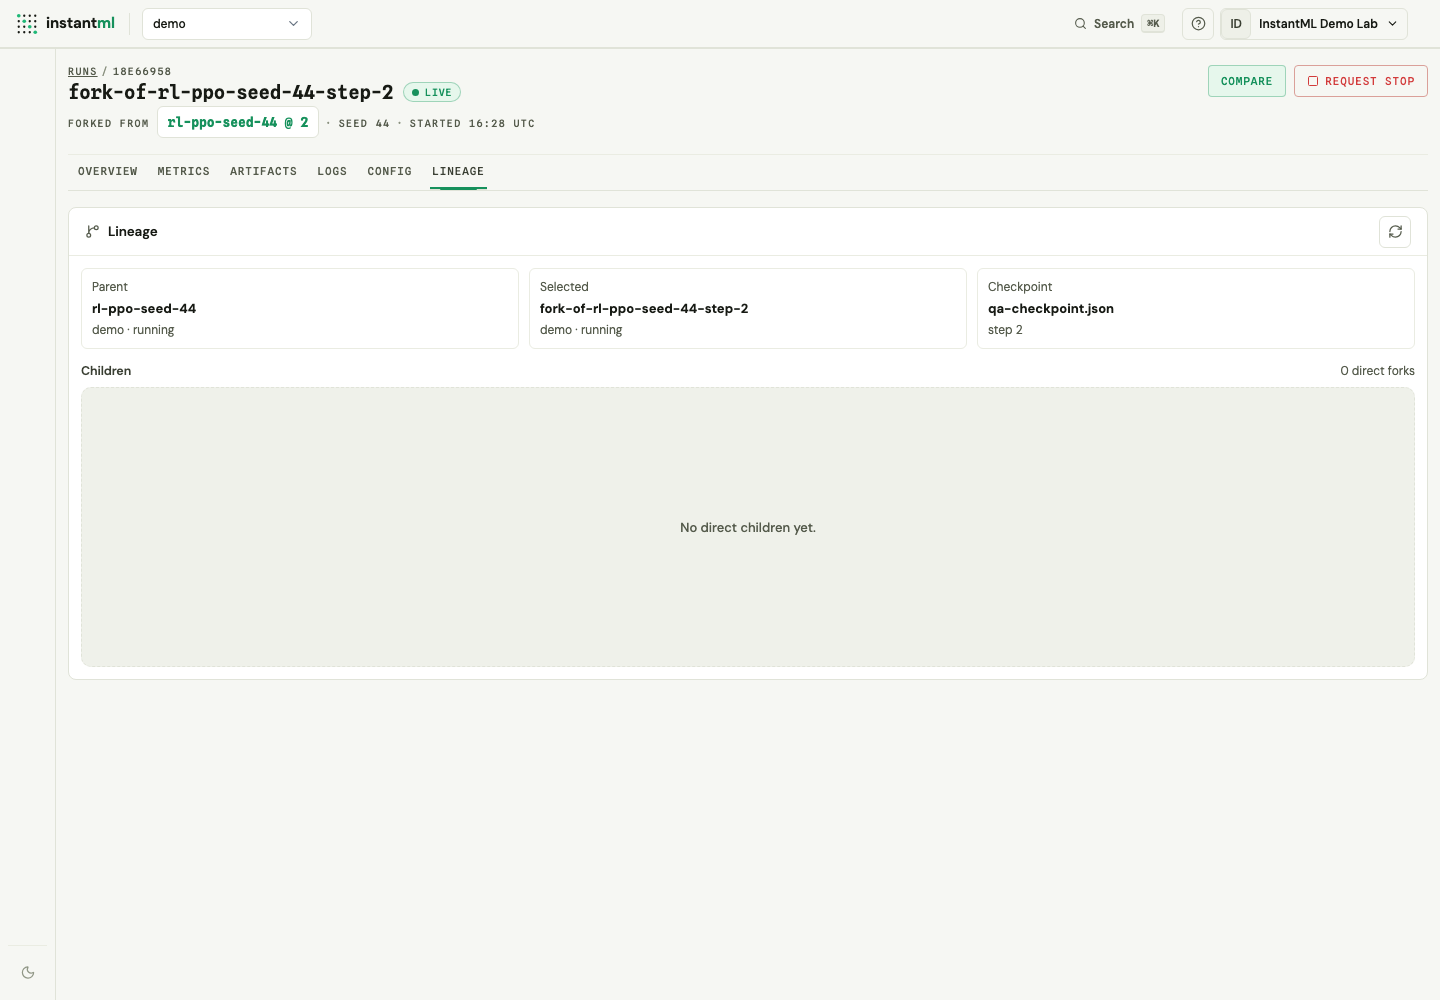
The Lineage tab shows the selected run's direct parent, checkpoint, and bounded child context.
Browse artifacts
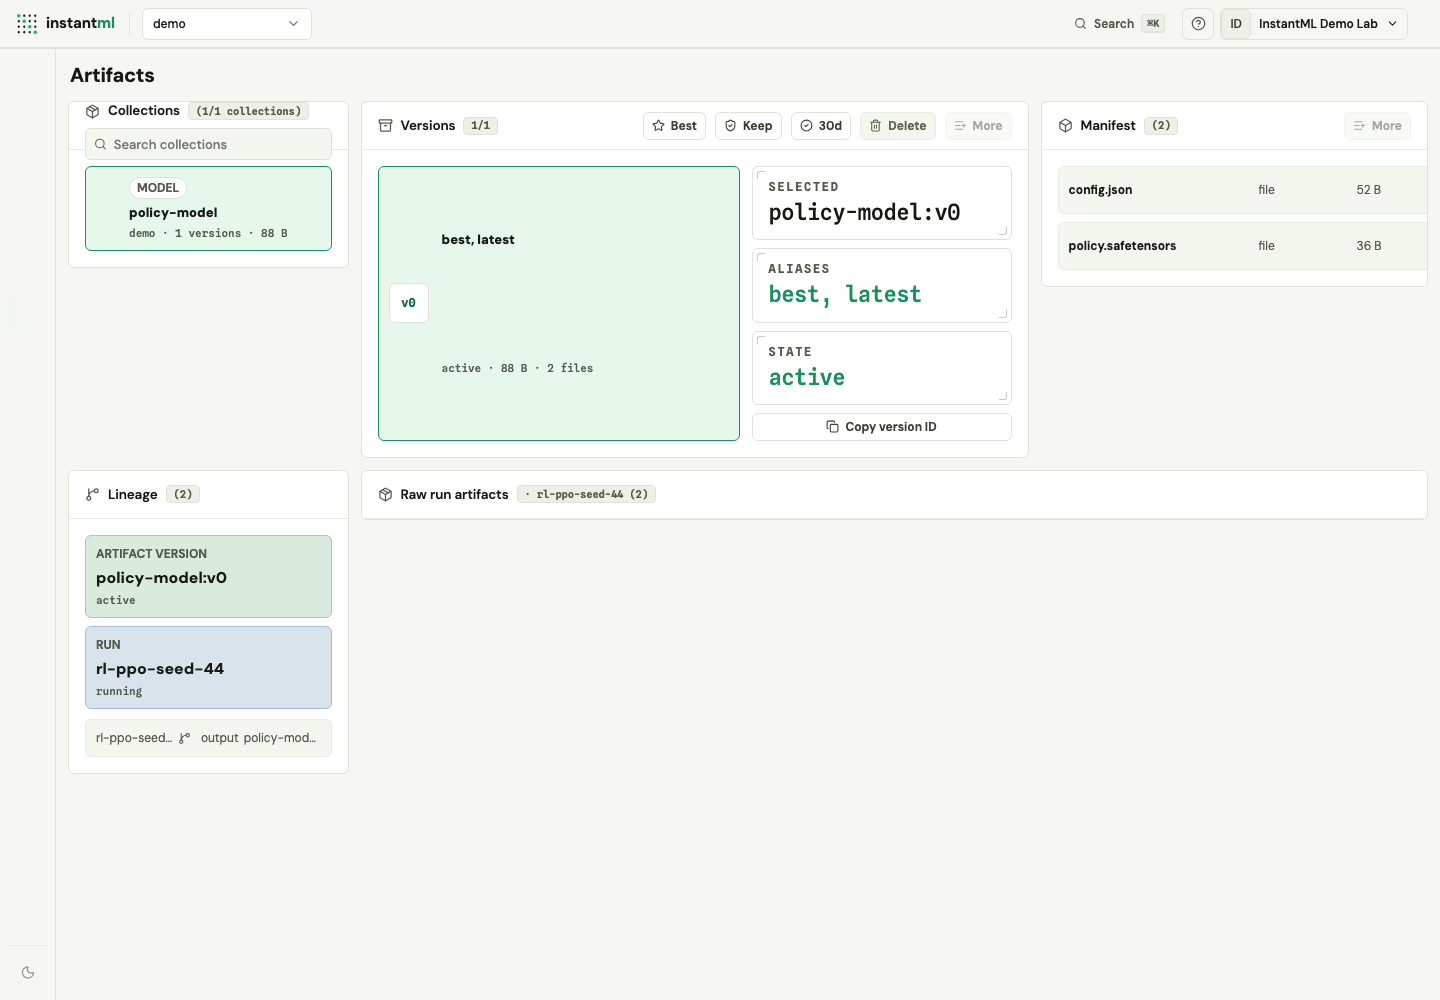
The Artifacts workspace shows versioned collections first: aliases such as latest and best, manifest entries, retention/delete controls for owners and admins, and bounded producer/consumer lineage. Raw run files and media stay in the Run Detail Artifacts tab.
Write reports
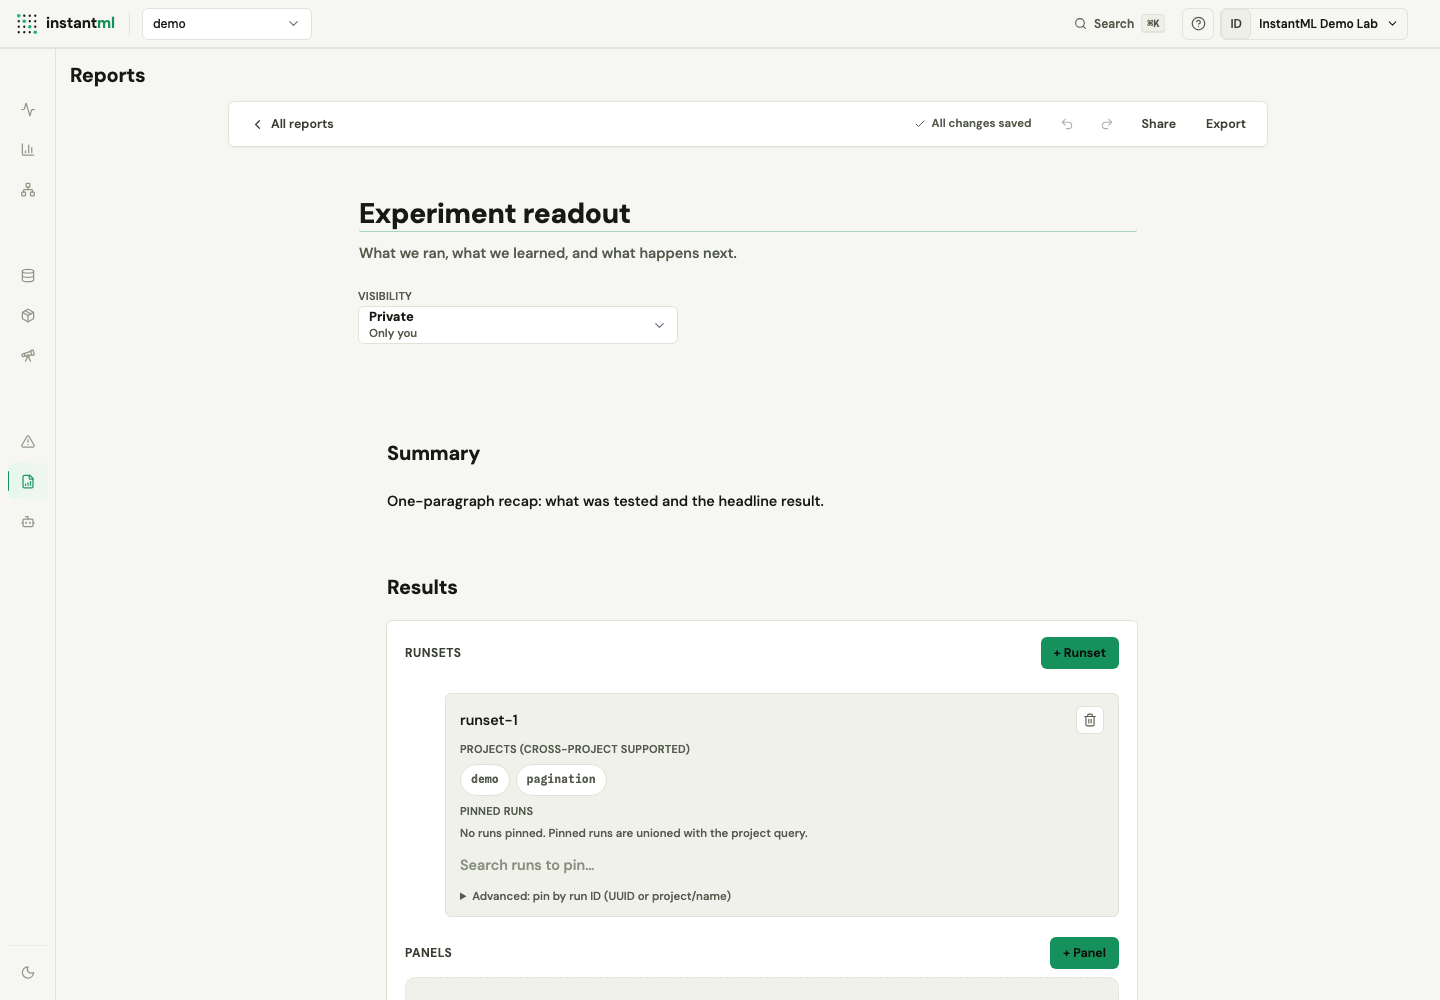
Reports are block-based writeups with live panel grids, share links, and Markdown export. Start one from the Reports surface with New report or Start from template.