Quickstart
Install InstantML, log your first run, and compare runs in the dashboard in five minutes.
Log a simulated training run to hosted InstantML — no ML frameworks or datasets required — and see it charted in the dashboard. You need Python 3.11 or newer and an InstantML account.
Install the SDK
Install the package into your environment:
python -m pip install instantmlLog in
Authenticate once from the terminal:
instantml loginThe CLI opens a browser device-code page, then stores an SDK credential in ~/.instantml/credentials. The Python SDK picks it up automatically. Confirm with instantml whoami.
Log your first run
Create train.py. It simulates a 50-step training loop with synthetic metrics, so it runs in seconds:
import math
import random
import sys

import instantml as im

seed = int(sys.argv[1]) if len(sys.argv) > 1 else 42
random.seed(seed)

run = im.init(
    project="quickstart",
    name=f"baseline-seed-{seed}",
    config={"seed": seed, "model": "tiny-mlp", "learning_rate": 3e-4},
    tags=["quickstart"],
)

for step in range(1, 51):
    loss = math.exp(-step / 18) + random.random() * 0.02
    accuracy = min(0.98, 0.5 + step / 120 + random.random() * 0.01)
    run.log({"train/loss": loss, "eval/accuracy": accuracy}, step=step)

run.finish()
print(f"Finished run {run.run_id}")
Run it:
python train.pyYou should see:
Finished run <run-id>Open the dashboard
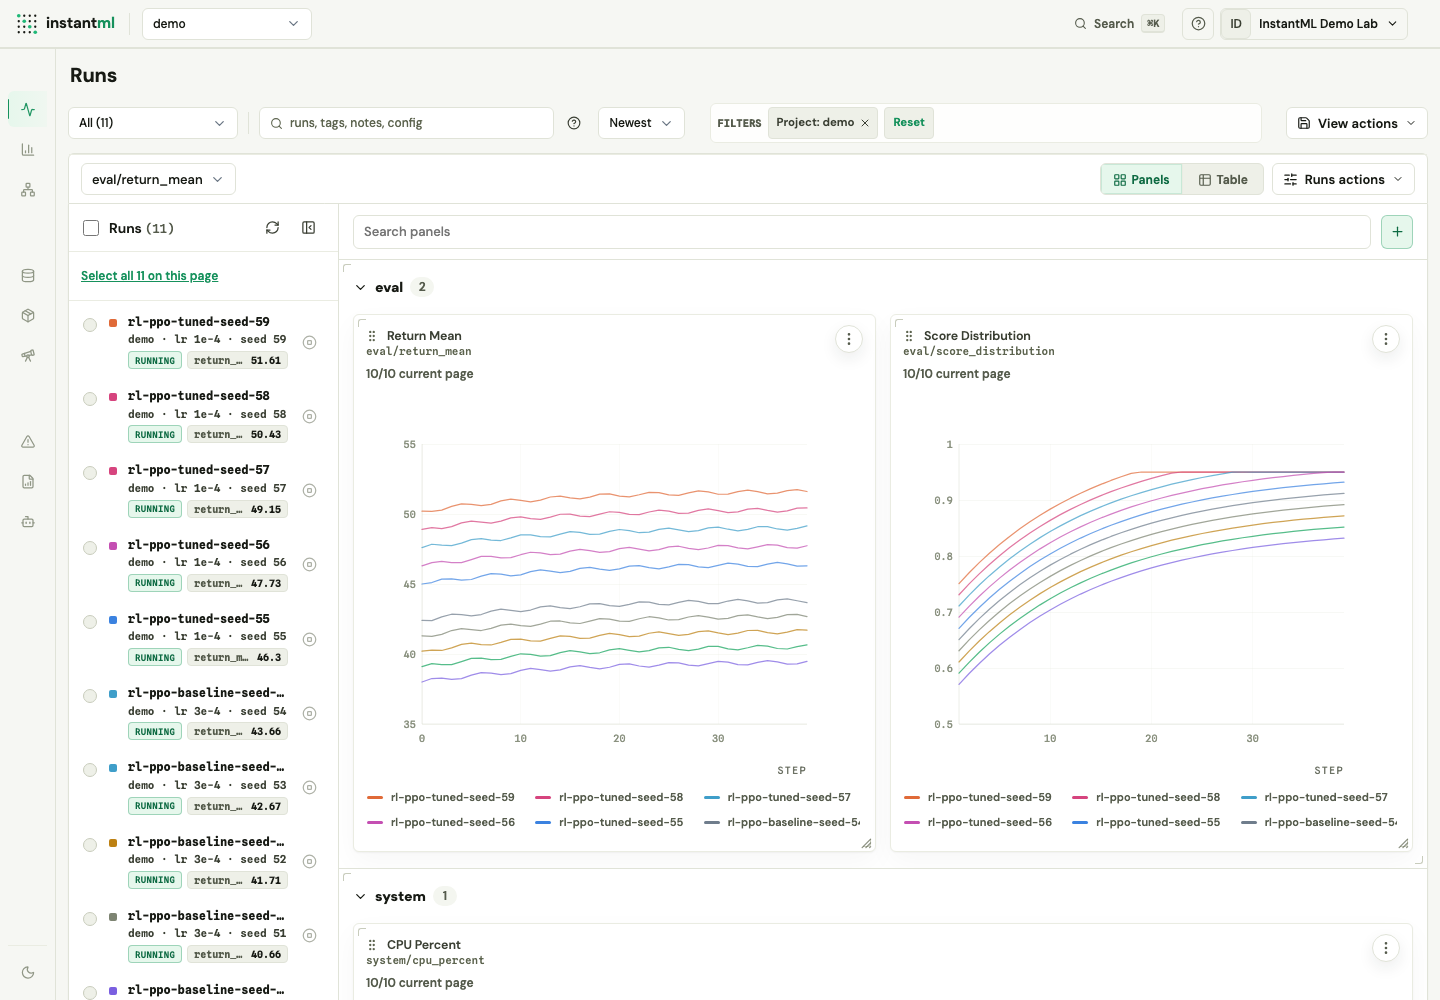
Open instantml.ai and select the quickstart project. Your run appears in the Runs workspace with live summary values, and the Run Detail view charts train/loss and eval/accuracy over all 50 steps.
Compare runs
The real payoff is comparison. Launch three more runs with different seeds:
python train.py 7
python train.py 21
python train.py 99
Back in the Runs workspace, switch the Panels ⇄ Table toggle to Table and select all four runs. A side-by-side comparison renders above the table — metric values and config rows lined up, so the effect of seed is visible at a glance. See Compare runs for goal-aware deltas and reference runs.
Next steps
- Install and authenticate the SDK — API keys, scopes, and CI setup
- Metrics and steps — metric naming and step semantics
- Configs, tags, and notes — make runs searchable and comparable
- Query runs and metrics — load existing runs from scripts and notebooks
- W&B integration — shadow or mirror W&B runs during migration
- Troubleshooting — first checks when a run does not appear