Tracing
Record nested rollout, reward, model, tool, and evaluator spans from Python SDK runs.
Tracing
Tracing records product-level execution spans for a run. Use it when scalar metrics tell you that a run changed, but you need to inspect why: rollout steps, policy calls, retrieval/tool hops, evaluator examples, reward scoring, or synthetic-data pipelines.
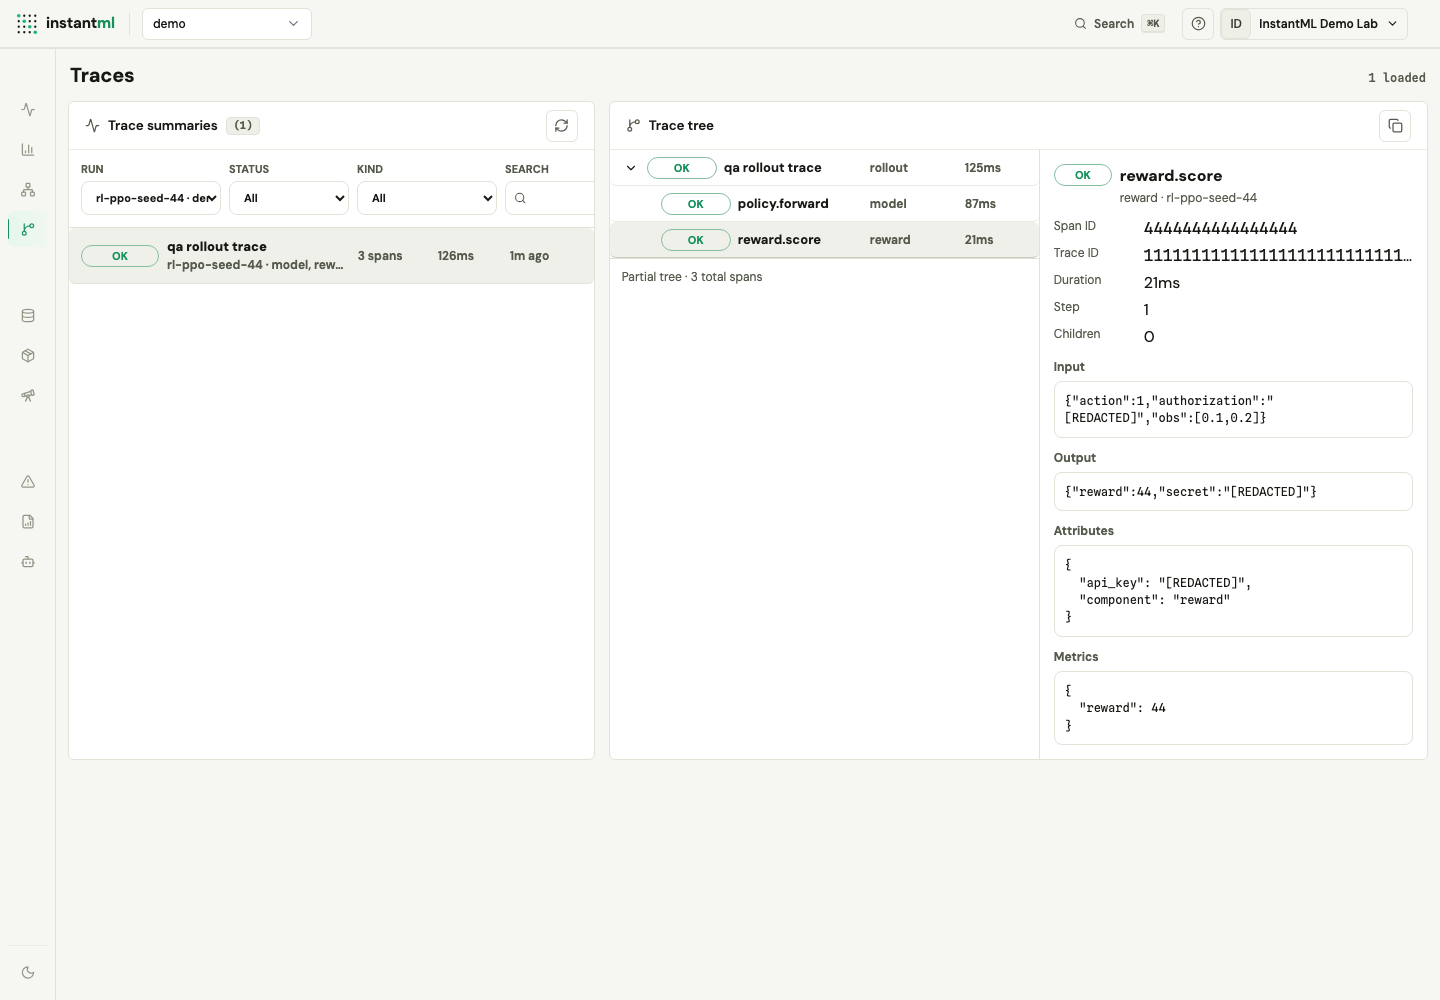
Trace data is stored beside the run that produced it. The dashboard can open a trace from Run Detail or from the global Traces workspace, then lazy-load child spans so large trees remain responsive.
When to trace
Use metrics for values you want to aggregate over time, such as loss, return, accuracy, throughput, or GPU utilization.
Use traces for structured execution evidence:
- One RL rollout with environment steps, policy calls, and reward scoring.
- One evaluator example with retrieval, model generation, and rubric scoring.
- One agent turn with tool calls and model responses.
- One data-generation item with preprocessing, model calls, and validation.
Keep the first trace slice small. A root span plus a few meaningful child spans is usually more useful than tracing every function in a hot loop.
Basic trace tree
run.trace(...) creates a root span. Child spans inherit the trace id, thread id, rank, and parent span id.
import instantml as im

run = im.init(
    project="cartpole",
    name="ppo-seed-42",
    config={"algorithm": "ppo", "env": "CartPole-v1", "seed": 42},
)

with run.trace(
    "rollout episode 42",
    kind="rollout",
    step=42,
    attributes={"env": "CartPole-v1"},
    inputs={"episode": 42},
    capture="preview",
) as rollout:
    with rollout.span(
        "policy.forward",
        kind="model",
        inputs={"observation": [0.0, 0.1, 0.2, 0.3]},
        capture="preview",
    ) as policy:
        action = 1
        policy.set_output({"action": action})

    with rollout.span("env.step", kind="env_step", capture="off") as step_span:
        reward = 1.0
        step_span.log_metric("reward", reward)

run.finish()
The root span appears as the trace summary. Child spans appear in the trace tree and can be expanded on demand.
Span parameters
run.trace(...), trace.span(...), and run.start_span(...) accept the same span fields. Only name is required.
| Parameter | Purpose |
|---|---|
kind | Span label used for filtering and summary counts. Defaults to custom. |
step | Training step or episode the span belongs to. |
rank | Distributed rank; inherited by child spans when unset. |
thread_id | Groups spans that belong to one agent session or turn. Defaults to the trace id. |
rollout_id | Application-defined rollout or episode identifier. |
attributes | Short searchable labels. Serialized attributes are capped at 32 KB per span. |
metrics | Numeric span metrics such as reward or token counts. Capped at 16 KB per span. |
links | Related trace or span references. |
capture | "off" (default) or "preview". See Privacy and capture. |
inputs | Input payload, previewed only under capture="preview". |
trace_id | Override the generated trace id, for example to stitch across processes. |
span_id | Override the generated span id. |
run.start_span(...) and trace.span(...) also take parent_span_id.
Kinds are validated against a fixed vocabulary. The SDK accepts rollout, env_step, model, tool, retrieval, reward, evaluator, dataset, preprocessing, postprocessing, checkpoint, artifact, system, and custom. Any other value raises ValueError, so use custom when none of the specific kinds fit.
Decorate operations
run.trace_op(...) wraps a sync or async function and records one span per call. It nests under the active same-run span when there is one; outside an active trace, it creates a root span and batches events until flush() or finish().
@run.trace_op(
    name="reward.score",
    kind="reward",
    step=42,
    attributes={"component": "dense-reward"},
    metrics={"gen_ai.usage.input_tokens": 12},
    capture="preview",
)
def score_reward(observation, action, authorization):
    # The preview redactor masks common secret keys and token-like values.
    return {"reward": 0.92}

with run.trace("rollout episode 42", kind="rollout", step=42, capture="preview"):
    score_reward(
        {"state": [0.0, 0.1, 0.2, 0.3]},
        "accelerate",
        authorization="Bearer service-token",
    )
The decorator preserves return values and re-raises exceptions. If the wrapped function raises, InstantML records an error span with the exception type. With the default capture="off", it does not store the exception message preview.
Decorator-level static span_id is intentionally unsupported so repeated calls remain independent spans.
Async functions
Decorated coroutine functions are awaited before the span finishes, so return previews and exceptions reflect the actual coroutine body.
@run.trace_op(name="judge.answer", kind="evaluator", capture="preview")
async def judge_answer(prompt, answer):
    score = await rubric_model(prompt, answer)
    return {"score": score}

result = await judge_answer("question", "answer")
Privacy and capture
capture="off" is the default. It stores names, span kinds, status, timing, attributes, metrics, and links, but no input, output, or exception-message preview.
Use capture="preview" only for bounded debugging evidence. The SDK:
- serializes previews best-effort without changing user-code behavior;
- redacts common secret keys such as
api_key,authorization,password,secret, andtoken; - redacts token-like values such as bearer tokens,
instantml_...API keys,sk-..., and webhook secrets; - truncates previews before writing local queues, process spool files, offline replay files, or network requests.
Local queue and spool files are still plaintext after redaction, so avoid preview capture for raw private data or large payloads. Put aggregate facts in metrics and short searchable labels in attributes.
Context propagation
Use trace.context() when worker code needs to attach spans to the current trace.
with run.trace("batch item 17", kind="preprocessing") as trace:
    carrier = trace.context()

send_to_worker(carrier)

def worker(carrier):
    with run.attach_trace_context(carrier):
        with run.start_span("worker.tokenize", kind="preprocessing"):
            tokenize()
Context carriers are run-scoped. Attaching a carrier from a different run raises an error instead of accidentally linking spans across runs.
Delivery modes
Trace events use the same delivery guarantees as other SDK writes:
| Mode | Trace behavior |
|---|---|
| Default async | Batches go through the SQLite async queue. |
upload_mode="sync" | flush() and finish() submit foreground HTTP requests. |
upload_mode="spool" | Batches are written as replayable process-spool requests. |
offline_dir | Failed post-create trace requests are stored and replayed with the original idempotency key. |
Trace ingest uses POST /api/runs/:run_id/traces/events with an Idempotency-Key, so retrying the same accepted batch is safe. The SDK keeps batching cheap on the decorator path by estimating trace-event byte size for flush decisions instead of serializing each event twice.
Dashboard workflow
Open a run's Traces section to see recent traces for that run, plus a step-axis timeline that lines up a run metric with per-step trace activity so a metric dip and the steps where traces erred read together:
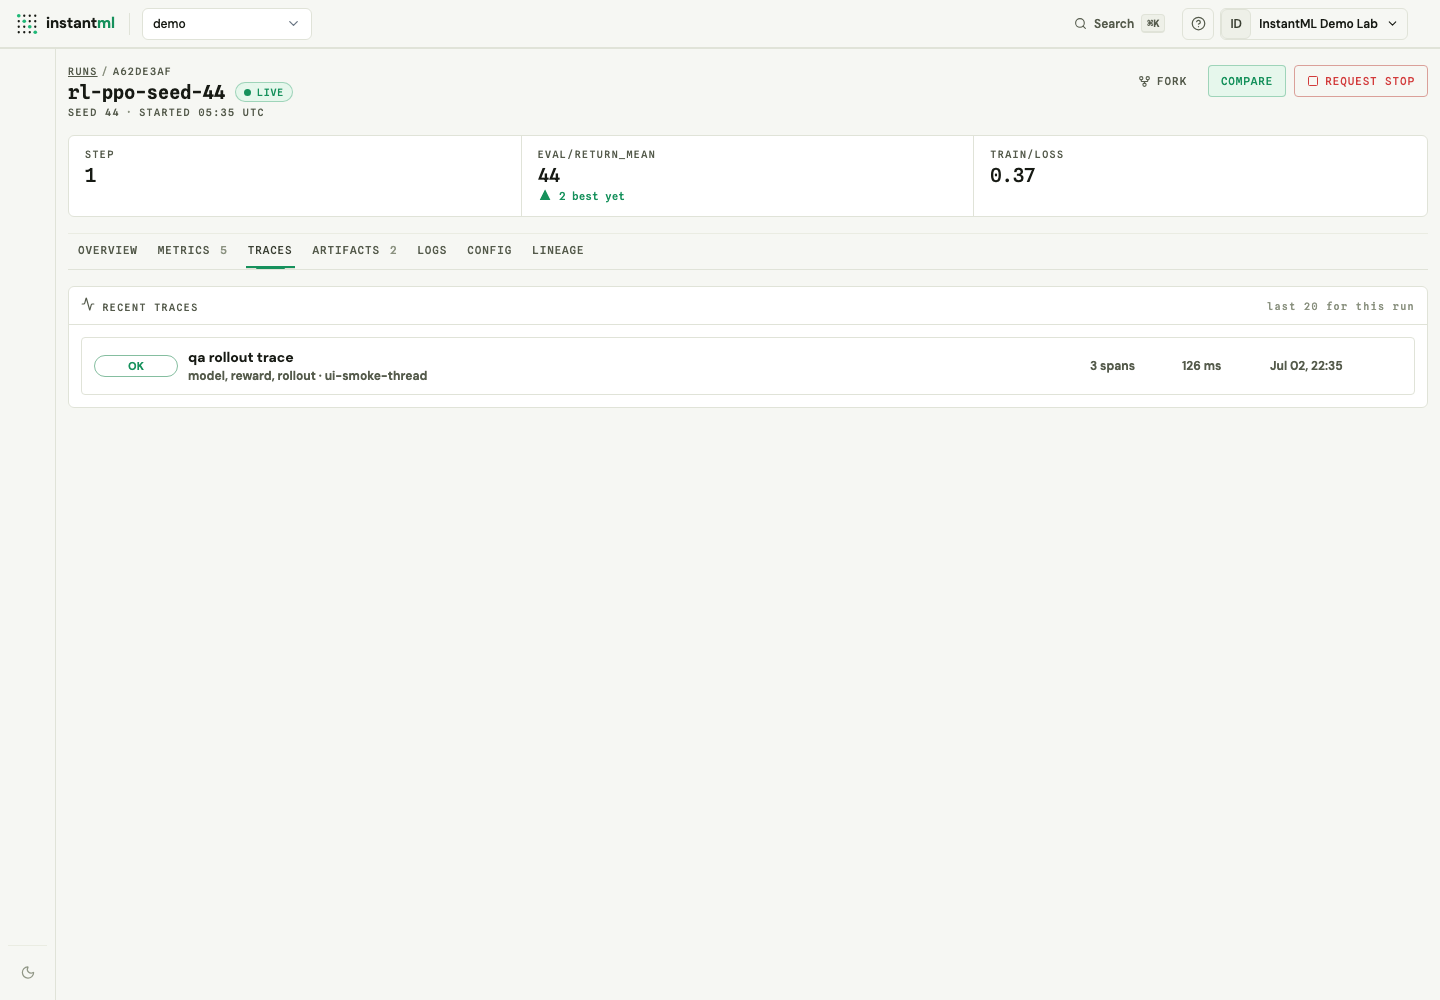
Click a trace row to open the full Traces workspace. The full workspace lets you filter by run, status, kind, and search text; inspect the trace summary; expand child spans lazily; and copy span or trace identifiers for support tickets. Search text is split into terms, so rollout step can match a root span named rollout.step2.g2. Trace search accepts up to eight terms. Project-scoped browsing uses a recent default window, while run-scoped trace lists show all traces for that run unless a date window is supplied. That keeps older imported or backfilled runs reachable from Run Detail and copied deep links.
Recommended RL shape
For RL pipelines, keep metrics and traces complementary:
for episode in range(num_episodes):
    run.log_metrics(
        {
            "train/episode_return": episode_return,
            "train/policy_loss": policy_loss,
            "eval/return_mean": eval_return,
        },
        step=episode,
    )

    if episode % 25 == 0:
        with run.trace("eval rollout", kind="rollout", step=episode, capture="preview"):
            action = policy_forward(observation)
            score_reward(observation, action, authorization="Bearer service-token")
Log every scalar you need to compare, but trace only representative rollouts or failures. That keeps the dashboard fast while preserving enough execution evidence to debug regressions.